
📚 New Technical analysis for [ Tezos ]
🎯 #XTZ/BTC
🪄 XTZ Chart ➖ Tradingview Idea
🔸 We've detected a Resistance Breakout and Confirmation on the $XTZ / $BTC chart. The price has broken above a key resistance level and has been confirmed by a strong candle, indicating a potential bullish trend. The next resistance key levels are at 0.00005055 | 0.00005207 | 0.00005607 and the major support zones are respectively at 0.00004655 | 0.00004407 | 0.00004007. We may consider entering a trade at the current price zone at 0.00005032 and targetting higher levels.
📊 Technical Metrics Index Summary:
🚥 Market Sentiment Index:
* Curated by MPDBreakout System.
* Unlock Trading Signal below.
🎯 #XTZ/BTC
🪄 XTZ Chart ➖ Tradingview Idea
🔸 We've detected a Resistance Breakout and Confirmation on the $XTZ / $BTC chart. The price has broken above a key resistance level and has been confirmed by a strong candle, indicating a potential bullish trend. The next resistance key levels are at 0.00005055 | 0.00005207 | 0.00005607 and the major support zones are respectively at 0.00004655 | 0.00004407 | 0.00004007. We may consider entering a trade at the current price zone at 0.00005032 and targetting higher levels.
📊 Technical Metrics Index Summary:
⎿ Mrkt Price ⌁ 0.00005032 ₿⎿ 24hChng: 🔺 4.681%⎿ 24hVol: 29.760 ₿⎿ Osciltrs: BUY⎿ MAs: STRONG_BUY🚥 Market Sentiment Index:
⎿ News: N/A⎿ Twitter: 0.62 - Bullish⎿ Reddit: 0.52 - Bullish* Curated by MPDBreakout System.
* Unlock Trading Signal below.
📚 New Technical analysis for [ Flamingo ]
🎯 #FLM/BTC
🪄 FLM Chart ➖ Tradingview Idea
🔸 Hey traders, we've identified a Resistance Breakout on the $FLM / $BTC chart. The price has broken above a key resistance level, which can indicate a potential bullish trend. Taking in consideration the next resistance key levels are at 0.0000052 | 0.0000055 | 0.00000626 and the major support zones are respectively at 0.00000444 | 0.00000398 | 0.00000322. It is a bullish indication and we may consider entering at the current price zone at 0.00000543 and targetting higher levels.
📊 Technical Metrics Index Summary:
🚥 Market Sentiment Index:
* Curated by MPDBreakout System.
* Unlock Trading Signal below.
🎯 #FLM/BTC
🪄 FLM Chart ➖ Tradingview Idea
🔸 Hey traders, we've identified a Resistance Breakout on the $FLM / $BTC chart. The price has broken above a key resistance level, which can indicate a potential bullish trend. Taking in consideration the next resistance key levels are at 0.0000052 | 0.0000055 | 0.00000626 and the major support zones are respectively at 0.00000444 | 0.00000398 | 0.00000322. It is a bullish indication and we may consider entering at the current price zone at 0.00000543 and targetting higher levels.
📊 Technical Metrics Index Summary:
⎿ Mrkt Price ⌁ 0.00000543 ₿⎿ 24hChng: 🚀 12.422%⎿ 24hVol: 52.979 ₿⎿ Osciltrs: BUY⎿ MAs: STRONG_BUY🚥 Market Sentiment Index:
⎿ News: N/A⎿ Twitter: 0.52 - Bullish⎿ Reddit: 0.80 - Very Bullish* Curated by MPDBreakout System.
* Unlock Trading Signal below.
📚 New Technical analysis for [ Algorand ]
🎯 #ALGO/BTC
🪄 ALGO Chart ➖ Tradingview Idea
🔸 Hey traders, we've identified a Bollinger Band breakout on the $ALGO / $BTC chart. The price has moved outside of the upper Bollinger Band, which can indicate a potential bullish trend. The next resistance key levels are at 0.00001206 | 0.00001266 | 0.00001393 and the major support zones are respectively at 0.00001079 | 0.00001012 | 0.00000885. We may consider buying at the current price zone 0.00001154 and targetting higher levels.
📊 Technical Metrics Index Summary:
* Unlock Trading Signal below.
🎯 #ALGO/BTC
🪄 ALGO Chart ➖ Tradingview Idea
🔸 Hey traders, we've identified a Bollinger Band breakout on the $ALGO / $BTC chart. The price has moved outside of the upper Bollinger Band, which can indicate a potential bullish trend. The next resistance key levels are at 0.00001206 | 0.00001266 | 0.00001393 and the major support zones are respectively at 0.00001079 | 0.00001012 | 0.00000885. We may consider buying at the current price zone 0.00001154 and targetting higher levels.
📊 Technical Metrics Index Summary:
⎿  Mrkt Price ⌁ 0.00001154 ₿
⎿  24hChng: 🔺 0.874%
⎿  24hVol: 54.442 ₿
⎿  Osciltrs: NEUTRAL
⎿  MAs: STRONG_BUY
🚥 Market Sentiment Index:⎿ News: N/A
⎿ Twitter: 0.53 - Bullish
⎿ Reddit: 0.38 - Bearish
* Curated by MPDBreakout System.* Unlock Trading Signal below.
📚 New Technical analysis for [ Bancor ]
🎯 #BNT/BTC
🪄 BNT Chart ➖ Tradingview Idea
🔸 We've detected a Resistance Breakout and Confirmation on the $BNT / $BTC chart. The price has broken above a key resistance level and has been confirmed by a strong candle, indicating a potential bullish trend. The next resistance key levels are at 0.0000207 | 0.00002143 | 0.00002306 and the major support zones are respectively at 0.00001907 | 0.00001817 | 0.00001654. We may consider entering a trade at the current price zone at 0.00002045 and targetting higher levels.
📊 Technical Metrics Index Summary:
🚥 Market Sentiment Index:
* Curated by MPDBreakout System.
* Unlock Trading Signal below.
🎯 #BNT/BTC
🪄 BNT Chart ➖ Tradingview Idea
🔸 We've detected a Resistance Breakout and Confirmation on the $BNT / $BTC chart. The price has broken above a key resistance level and has been confirmed by a strong candle, indicating a potential bullish trend. The next resistance key levels are at 0.0000207 | 0.00002143 | 0.00002306 and the major support zones are respectively at 0.00001907 | 0.00001817 | 0.00001654. We may consider entering a trade at the current price zone at 0.00002045 and targetting higher levels.
📊 Technical Metrics Index Summary:
⎿ Mrkt Price ⌁ 0.00002045 ₿⎿ 24hChng: 🔺 0.988%⎿ 24hVol: 4.624 ₿⎿ Osciltrs: NEUTRAL⎿ MAs: BUY🚥 Market Sentiment Index:
⎿ News: N/A⎿ Twitter: 0.57 - Bullish⎿ Reddit: 0.44 - Bearish* Curated by MPDBreakout System.
* Unlock Trading Signal below.
📚 New Technical analysis for [ Acala Token ]
🎯 #ACA/BTC
🪄 ACA Chart ➖ Tradingview Idea
🔸 Hey crypto lovers, we've identified bullish signals on the $ACA / $BTC chart through the detection of both a Bollinger Band and a Resistance Breakout. The Bollinger Band indicates a potential bullish trend as the price has moved outside of the upper band, while the Resistance Breakout confirms this trend by showing the price breaking above a key resistance level. Given the alignment of these signals, it may be a good idea to consider entering a long position and targeting higher levels. Our analysis indicates that the key resistance levels are at 0.00000636 | 0.00000686 | 0.00000791 and the major support zones are at 0.00000531 | 0.00000476 | 0.00000371. However, it is important to also consider other factors such as overall market conditions and other technical indicators before making a trade decision.
📊 Technical Metrics Index Summary:
🚥 Market Sentiment Index:
* Curated by MPDBreakout System.
* Unlock Trading Signal below.
🎯 #ACA/BTC
🪄 ACA Chart ➖ Tradingview Idea
🔸 Hey crypto lovers, we've identified bullish signals on the $ACA / $BTC chart through the detection of both a Bollinger Band and a Resistance Breakout. The Bollinger Band indicates a potential bullish trend as the price has moved outside of the upper band, while the Resistance Breakout confirms this trend by showing the price breaking above a key resistance level. Given the alignment of these signals, it may be a good idea to consider entering a long position and targeting higher levels. Our analysis indicates that the key resistance levels are at 0.00000636 | 0.00000686 | 0.00000791 and the major support zones are at 0.00000531 | 0.00000476 | 0.00000371. However, it is important to also consider other factors such as overall market conditions and other technical indicators before making a trade decision.
📊 Technical Metrics Index Summary:
⎿ Mrkt Price ⌁ 0.00000624 ₿⎿ 24hChng: 🔺 4.874%⎿ 24hVol: 19.545 ₿⎿ Osciltrs: NEUTRAL⎿ MAs: STRONG_BUY🚥 Market Sentiment Index:
⎿ News: N/A⎿ Twitter: N/A⎿ Reddit: N/A* Curated by MPDBreakout System.
* Unlock Trading Signal below.
📚 New Technical analysis for [ Oasis Network ]
🎯 #ROSE/USDT
🪄 ROSE Chart ➖ Tradingview Idea
🔸 Hey traders, we've identified a Trend Reversal on the $ROSE / $USDT chart. The trend of the price has reversed, indicating a potential trend change. The next resistance levels are located at 0.08419 | 0.09479 | 0.11426, while the main support levels can be found at 0.06472 | 0.05585 | 0.03638. It may be wise to consider buying at the current price of 0.07811 and benefit from the trend continuation.
📊 Technical Metrics Index Summary:
🚥 Market Sentiment Index:
* Curated by MPDBreakout System.
* Unlock Trading Signal below.
🎯 #ROSE/USDT
🪄 ROSE Chart ➖ Tradingview Idea
🔸 Hey traders, we've identified a Trend Reversal on the $ROSE / $USDT chart. The trend of the price has reversed, indicating a potential trend change. The next resistance levels are located at 0.08419 | 0.09479 | 0.11426, while the main support levels can be found at 0.06472 | 0.05585 | 0.03638. It may be wise to consider buying at the current price of 0.07811 and benefit from the trend continuation.
📊 Technical Metrics Index Summary:
⎿ Mrkt Price ⌁ 0.07811 ₮⎿ 24hChng: 🔺 3.635%⎿ 24hVol: 27,260,846.988 ₮⎿ Osciltrs: BUY⎿ MAs: STRONG_BUY🚥 Market Sentiment Index:
⎿ News: N/A⎿ Twitter: 0.70 - Bullish⎿ Reddit: 0.72 - Bullish* Curated by MPDBreakout System.
* Unlock Trading Signal below.
📚 New Technical analysis for [ Stellar ]
🎯 #XLM/USDT
🪄 XLM Chart ➖ Tradingview Idea
🔸 We've detected a Resistance Breakout and Confirmation on the $XLM / $USDT chart. The price has broken above a key resistance level and has been confirmed by a strong candle, indicating a potential bullish trend. The next resistance key levels are at 0.0955 | 0.1005 | 0.1124 and the major support zones are respectively at 0.0836 | 0.0767 | 0.0648. We may consider entering a trade at the current price zone at 0.0947 and targetting higher levels.
📊 Technical Metrics Index Summary:
🚥 Market Sentiment Index:
* Curated by MPDBreakout System.
* Unlock Trading Signal below.
🎯 #XLM/USDT
🪄 XLM Chart ➖ Tradingview Idea
🔸 We've detected a Resistance Breakout and Confirmation on the $XLM / $USDT chart. The price has broken above a key resistance level and has been confirmed by a strong candle, indicating a potential bullish trend. The next resistance key levels are at 0.0955 | 0.1005 | 0.1124 and the major support zones are respectively at 0.0836 | 0.0767 | 0.0648. We may consider entering a trade at the current price zone at 0.0947 and targetting higher levels.
📊 Technical Metrics Index Summary:
⎿ Mrkt Price ⌁ 0.0947 ₮⎿ 24hChng: 🔺 1.175%⎿ 24hVol: 11,029,334.616 ₮⎿ Osciltrs: NEUTRAL⎿ MAs: BUY🚥 Market Sentiment Index:
⎿ News: N/A⎿ Twitter: 0.61 - Bullish⎿ Reddit: 0.58 - Bullish* Curated by MPDBreakout System.
* Unlock Trading Signal below.
📚 New Technical analysis for [ Komodo ]
🎯 #KMD/BTC
🪄 KMD Chart ➖ Tradingview Idea
🔸 We've detected a Resistance Breakout and Confirmation on the $KMD / $BTC chart. The price has broken above a key resistance level and has been confirmed by a strong candle, indicating a potential bullish trend. The next resistance key levels are at 0.00001304 | 0.00001379 | 0.00001531 and the major support zones are respectively at 0.00001152 | 0.00001075 | 0.00000923. We may consider entering a trade at the current price zone at 0.00001288 and targetting higher levels.
📊 Technical Metrics Index Summary:
🚥 Market Sentiment Index:
* Curated by MPDBreakout System.
* Unlock Trading Signal below.
🎯 #KMD/BTC
🪄 KMD Chart ➖ Tradingview Idea
🔸 We've detected a Resistance Breakout and Confirmation on the $KMD / $BTC chart. The price has broken above a key resistance level and has been confirmed by a strong candle, indicating a potential bullish trend. The next resistance key levels are at 0.00001304 | 0.00001379 | 0.00001531 and the major support zones are respectively at 0.00001152 | 0.00001075 | 0.00000923. We may consider entering a trade at the current price zone at 0.00001288 and targetting higher levels.
📊 Technical Metrics Index Summary:
⎿ Mrkt Price ⌁ 0.00001288 ₿⎿ 24hChng: 🔻 -0.31%⎿ 24hVol: 17.668 ₿⎿ Osciltrs: NEUTRAL⎿ MAs: STRONG_BUY🚥 Market Sentiment Index:
⎿ News: N/A⎿ Twitter: 0.47 - Bearish⎿ Reddit: 0.82 - Very Bullish* Curated by MPDBreakout System.
* Unlock Trading Signal below.
📚 New Technical analysis for [ aelf ]
🎯 #ELF/BTC
🪄 ELF Chart ➖ Tradingview Idea
🔸 We have identified both a Super Trend pattern and a Resistance Breakout on the $ELF / $BTC chart. Both indicators are signaling a bullish trend, with the Super Trend showing a bullish trend and the Resistance Breakout confirming this trend by showing the price breaking above a key resistance level. Given the alignment of these signals, it may be a good idea to consider entering a long position and targeting higher levels. Our analysis indicates that the key resistance levels are at 0.00001076 | 0.00001159 | 0.00001307 and the major support zones are at 0.00000928 | 0.00000863 | 0.00000715. However, it is important to also consider other factors such as overall market conditions and other technical indicators before making a trade decision.
📊 Technical Metrics Index Summary:
🚥 Market Sentiment Index:
* Curated by MPDBreakout System.
* Unlock Trading Signal below.
🎯 #ELF/BTC
🪄 ELF Chart ➖ Tradingview Idea
🔸 We have identified both a Super Trend pattern and a Resistance Breakout on the $ELF / $BTC chart. Both indicators are signaling a bullish trend, with the Super Trend showing a bullish trend and the Resistance Breakout confirming this trend by showing the price breaking above a key resistance level. Given the alignment of these signals, it may be a good idea to consider entering a long position and targeting higher levels. Our analysis indicates that the key resistance levels are at 0.00001076 | 0.00001159 | 0.00001307 and the major support zones are at 0.00000928 | 0.00000863 | 0.00000715. However, it is important to also consider other factors such as overall market conditions and other technical indicators before making a trade decision.
📊 Technical Metrics Index Summary:
⎿ Mrkt Price ⌁ 0.00001016 ₿⎿ 24hChng: 🔺 0.994%⎿ 24hVol: 17.623 ₿⎿ Osciltrs: NEUTRAL⎿ MAs: STRONG_BUY🚥 Market Sentiment Index:
⎿ News: N/A⎿ Twitter: 0.34 - Bearish⎿ Reddit: 0.61 - Bullish* Curated by MPDBreakout System.
* Unlock Trading Signal below.
⚡1
📚 New Technical analysis for [ Basic Attention Token ]
🎯 #BAT/BTC
🪄 BAT Chart ➖ Tradingview Idea
🔸 Hey traders, we've identified a Resistance Breakout on the $BAT / $BTC chart. The price has broken above a key resistance level, which can indicate a potential bullish trend. Taking in consideration the next resistance key levels are at 0.00001375 | 0.0000148 | 0.00001661 and the major support zones are respectively at 0.00001194 | 0.00001118 | 0.00000937. It is a bullish indication and we may consider entering at the current price zone at 0.00001348 and targetting higher levels.
📊 Technical Metrics Index Summary:
🚥 Market Sentiment Index:
* Curated by MPDBreakout System.
* Unlock Trading Signal below.
🎯 #BAT/BTC
🪄 BAT Chart ➖ Tradingview Idea
🔸 Hey traders, we've identified a Resistance Breakout on the $BAT / $BTC chart. The price has broken above a key resistance level, which can indicate a potential bullish trend. Taking in consideration the next resistance key levels are at 0.00001375 | 0.0000148 | 0.00001661 and the major support zones are respectively at 0.00001194 | 0.00001118 | 0.00000937. It is a bullish indication and we may consider entering at the current price zone at 0.00001348 and targetting higher levels.
📊 Technical Metrics Index Summary:
⎿ Mrkt Price ⌁ 0.00001348 ₿⎿ 24hChng: 🚀 6.815%⎿ 24hVol: 16.478 ₿⎿ Osciltrs: NEUTRAL⎿ MAs: STRONG_BUY🚥 Market Sentiment Index:
⎿ News: N/A⎿ Twitter: 0.56 - Bullish⎿ Reddit: 0.35 - Bearish* Curated by MPDBreakout System.
* Unlock Trading Signal below.
Forwarded from Crypto2AF™ Signals VIP
https://s3.tradingview.com/snapshots/t/tB9aXMrf.png
Please open Telegram to view this post
VIEW IN TELEGRAM
😱1
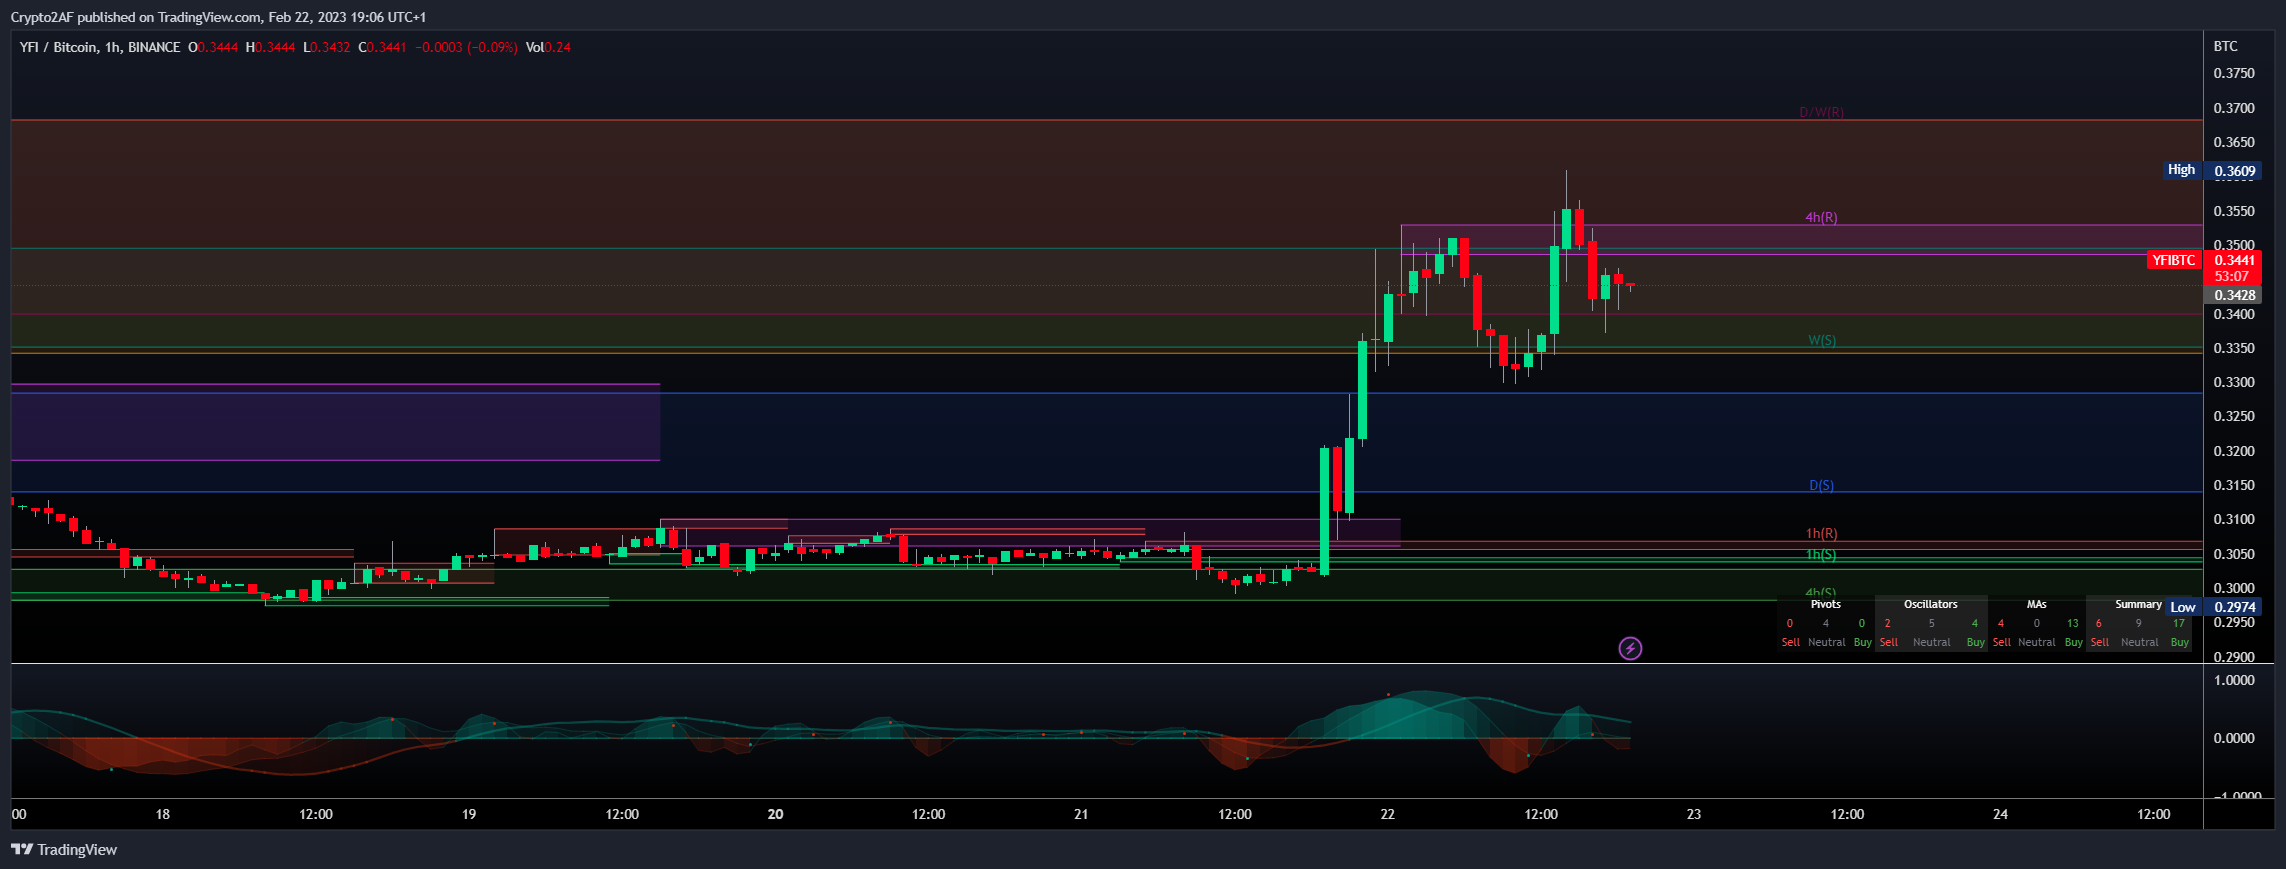
📚 New Technical analysis for [ yearn.finance ]
🎯 #YFI/BTC
🪄 YFI Chart ➖ Tradingview Idea
🔸 Hey traders, we've identified a Resistance Breakout on the $YFI / $BTC chart. The price has broken above a key resistance level, which can indicate a potential bullish trend. Taking in consideration the next resistance key levels are at 0.3241 | 0.343 | 0.3753 and the major support zones are respectively at 0.2918 | 0.2784 | 0.2461. It is a bullish indication and we may consider entering at the current price zone at 0.3441 and targetting higher levels.
📊 Technical Metrics Index Summary:
🚥 Market Sentiment Index:
* Curated by MPDBreakout System.
* Unlock Trading Signal below.
🎯 #YFI/BTC
🪄 YFI Chart ➖ Tradingview Idea
🔸 Hey traders, we've identified a Resistance Breakout on the $YFI / $BTC chart. The price has broken above a key resistance level, which can indicate a potential bullish trend. Taking in consideration the next resistance key levels are at 0.3241 | 0.343 | 0.3753 and the major support zones are respectively at 0.2918 | 0.2784 | 0.2461. It is a bullish indication and we may consider entering at the current price zone at 0.3441 and targetting higher levels.
📊 Technical Metrics Index Summary:
⎿ Mrkt Price ⌁ 0.3441 ₿⎿ 24hChng: 🚀 13.79%⎿ 24hVol: 116.698 ₿⎿ Osciltrs: NEUTRAL⎿ MAs: STRONG_BUY🚥 Market Sentiment Index:
⎿ News: N/A⎿ Twitter: 0.68 - Bullish⎿ Reddit: 0.53 - Bullish* Curated by MPDBreakout System.
* Unlock Trading Signal below.
📚 New Technical analysis for [ Secret ]
🎯 #SCRT/BTC
🪄 SCRT Chart ➖ Tradingview Idea
🔸 Hey traders, we've identified a Trend Reversal on the $SCRT / $BTC chart. The trend of the price has reversed, indicating a potential trend change. The next resistance levels are located at 0.00003534 | 0.00003776 | 0.00004191, while the main support levels can be found at 0.00003119 | 0.00002946 | 0.00002531. It may be wise to consider buying at the current price of 0.0000344 and benefit from the trend continuation.
📊 Technical Metrics Index Summary:
🚥 Market Sentiment Index:
* Curated by MPDBreakout System.
* Unlock Trading Signal below.
🎯 #SCRT/BTC
🪄 SCRT Chart ➖ Tradingview Idea
🔸 Hey traders, we've identified a Trend Reversal on the $SCRT / $BTC chart. The trend of the price has reversed, indicating a potential trend change. The next resistance levels are located at 0.00003534 | 0.00003776 | 0.00004191, while the main support levels can be found at 0.00003119 | 0.00002946 | 0.00002531. It may be wise to consider buying at the current price of 0.0000344 and benefit from the trend continuation.
📊 Technical Metrics Index Summary:
⎿ Mrkt Price ⌁ 0.0000344 ₿⎿ 24hChng: 🚀 5.038%⎿ 24hVol: 8.909 ₿⎿ Osciltrs: NEUTRAL⎿ MAs: STRONG_BUY🚥 Market Sentiment Index:
⎿ News: N/A⎿ Twitter: N/A⎿ Reddit: N/A* Curated by MPDBreakout System.
* Unlock Trading Signal below.
📚 New Technical analysis for [ Radicle ]
🎯 #RAD/BTC
🪄 RAD Chart ➖ Tradingview Idea
🔸 We've detected a Resistance Breakout and Confirmation on the $RAD / $BTC chart. The price has broken above a key resistance level and has been confirmed by a strong candle, indicating a potential bullish trend. The next resistance key levels are at 0.0000905 | 0.0000941 | 0.0001031 and the major support zones are respectively at 0.0000815 | 0.0000761 | 0.0000671. We may consider entering a trade at the current price zone at 0.00009 and targetting higher levels.
📊 Technical Metrics Index Summary:
🚥 Market Sentiment Index:
* Curated by MPDBreakout System.
* Unlock Trading Signal below.
🎯 #RAD/BTC
🪄 RAD Chart ➖ Tradingview Idea
🔸 We've detected a Resistance Breakout and Confirmation on the $RAD / $BTC chart. The price has broken above a key resistance level and has been confirmed by a strong candle, indicating a potential bullish trend. The next resistance key levels are at 0.0000905 | 0.0000941 | 0.0001031 and the major support zones are respectively at 0.0000815 | 0.0000761 | 0.0000671. We may consider entering a trade at the current price zone at 0.00009 and targetting higher levels.
📊 Technical Metrics Index Summary:
⎿ Mrkt Price ⌁ 0.00009 ₿⎿ 24hChng: 🔺 4.167%⎿ 24hVol: 14.591 ₿⎿ Osciltrs: BUY⎿ MAs: STRONG_BUY🚥 Market Sentiment Index:
⎿ News: N/A⎿ Twitter: 0.72 - Bullish⎿ Reddit: 0.66 - Bullish* Curated by MPDBreakout System.
* Unlock Trading Signal below.
TradingView
$RAD/#BTC [#Radicle]: Resistance_Breakout_Confirmation for BINANCE:RADBTC by Crypto2AF
◳◱ We've detected a Resistance Breakout and Confirmation on the $RAD / $BTC chart. The price has broken above a key resistance level and has been confirmed by a strong candle, indicating a potential bullish trend. The next resistance key levels are at 0.0000905…
📚 New Technical analysis for [ Travala com ]
🎯 #AVA/BTC
🪄 AVA Chart ➖ Tradingview Idea
🔸 Hey traders, we've identified a Resistance Breakout on the $AVA / $BTC chart. The price has broken above a key resistance level, which can indicate a potential bullish trend. Taking in consideration the next resistance key levels are at 0.00003164 | 0.00003322 | 0.00003696 and the major support zones are respectively at 0.0000279 | 0.00002574 | 0.000022. It is a bullish indication and we may consider entering at the current price zone at 0.0000332 and targetting higher levels.
📊 Technical Metrics Index Summary:
🚥 Market Sentiment Index:
* Curated by MPDBreakout System.
* Unlock Trading Signal below.
🎯 #AVA/BTC
🪄 AVA Chart ➖ Tradingview Idea
🔸 Hey traders, we've identified a Resistance Breakout on the $AVA / $BTC chart. The price has broken above a key resistance level, which can indicate a potential bullish trend. Taking in consideration the next resistance key levels are at 0.00003164 | 0.00003322 | 0.00003696 and the major support zones are respectively at 0.0000279 | 0.00002574 | 0.000022. It is a bullish indication and we may consider entering at the current price zone at 0.0000332 and targetting higher levels.
📊 Technical Metrics Index Summary:
⎿ Mrkt Price ⌁ 0.0000332 ₿⎿ 24hChng: 🚀 7.097%⎿ 24hVol: 9.446 ₿⎿ Osciltrs: SELL⎿ MAs: STRONG_BUY🚥 Market Sentiment Index:
⎿ News: N/A⎿ Twitter: 0.75 - Bullish⎿ Reddit: 0.76 - Very Bullish* Curated by MPDBreakout System.
* Unlock Trading Signal below.
📚 New Technical analysis for [ Ethereum Name Service ]
🎯 #ENS/BTC
🪄 ENS Chart ➖ Tradingview Idea
🔸 Hey traders, we've identified a Resistance Breakout on the $ENS / $BTC chart. The price has broken above a key resistance level, which can indicate a potential bullish trend. Taking in consideration the next resistance key levels are at 0.0007104 | 0.0007417 | 0.0008238 and the major support zones are respectively at 0.0006283 | 0.0005775 | 0.0004954. It is a bullish indication and we may consider entering at the current price zone at 0.0006875 and targetting higher levels.
📊 Technical Metrics Index Summary:
🚥 Market Sentiment Index:
* Curated by MPDBreakout System.
* Unlock Trading Signal below.
🎯 #ENS/BTC
🪄 ENS Chart ➖ Tradingview Idea
🔸 Hey traders, we've identified a Resistance Breakout on the $ENS / $BTC chart. The price has broken above a key resistance level, which can indicate a potential bullish trend. Taking in consideration the next resistance key levels are at 0.0007104 | 0.0007417 | 0.0008238 and the major support zones are respectively at 0.0006283 | 0.0005775 | 0.0004954. It is a bullish indication and we may consider entering at the current price zone at 0.0006875 and targetting higher levels.
📊 Technical Metrics Index Summary:
⎿ Mrkt Price ⌁ 0.0006875 ₿⎿ 24hChng: 🔺 2.064%⎿ 24hVol: 12.040 ₿⎿ Osciltrs: NEUTRAL⎿ MAs: STRONG_BUY🚥 Market Sentiment Index:
⎿ News: N/A⎿ Twitter: 0.59 - Bullish⎿ Reddit: 0.71 - Bullish* Curated by MPDBreakout System.
* Unlock Trading Signal below.
📚 New Technical analysis for [ FIO Protocol ]
🎯 #FIO/USDT
🪄 FIO Chart ➖ Tradingview Idea
🔸 We've detected a Resistance Breakout and Confirmation on the $FIO / $USDT chart. The price has broken above a key resistance level and has been confirmed by a strong candle, indicating a potential bullish trend. The next resistance key levels are at 0.0472 | 0.0536 | 0.0678 and the major support zones are respectively at 0.033 | 0.0252 | 0.011. We may consider entering a trade at the current price zone at 0.0453 and targetting higher levels.
📊 Technical Metrics Index Summary:
🚥 Market Sentiment Index:
* Curated by MPDBreakout System.
* Unlock Trading Signal below.
🎯 #FIO/USDT
🪄 FIO Chart ➖ Tradingview Idea
🔸 We've detected a Resistance Breakout and Confirmation on the $FIO / $USDT chart. The price has broken above a key resistance level and has been confirmed by a strong candle, indicating a potential bullish trend. The next resistance key levels are at 0.0472 | 0.0536 | 0.0678 and the major support zones are respectively at 0.033 | 0.0252 | 0.011. We may consider entering a trade at the current price zone at 0.0453 and targetting higher levels.
📊 Technical Metrics Index Summary:
⎿ Mrkt Price ⌁ 0.0453 ₮⎿ 24hChng: 🚀 7.092%⎿ 24hVol: 1,388,249.465 ₮⎿ Osciltrs: BUY⎿ MAs: STRONG_BUY🚥 Market Sentiment Index:
⎿ News: N/A⎿ Twitter: 0.56 - Bullish⎿ Reddit: 0.73 - Bullish* Curated by MPDBreakout System.
* Unlock Trading Signal below.
📚 New Technical analysis for [ Decred ]
🎯 #DCR/BTC
🪄 DCR Chart ➖ Tradingview Idea
🔸 We have identified both a Super Trend pattern and a Resistance Breakout on the $DCR / $BTC chart. Both indicators are signaling a bullish trend, with the Super Trend showing a bullish trend and the Resistance Breakout confirming this trend by showing the price breaking above a key resistance level. Given the alignment of these signals, it may be a good idea to consider entering a long position and targeting higher levels. Our analysis indicates that the key resistance levels are at 0.001123 | 0.001189 | 0.001334 and the major support zones are at 0.000978 | 0.000899 | 0.000754. However, it is important to also consider other factors such as overall market conditions and other technical indicators before making a trade decision.
📊 Technical Metrics Index Summary:
🚥 Market Sentiment Index:
* Curated by MPDBreakout System.
* Unlock Trading Signal below.
🎯 #DCR/BTC
🪄 DCR Chart ➖ Tradingview Idea
🔸 We have identified both a Super Trend pattern and a Resistance Breakout on the $DCR / $BTC chart. Both indicators are signaling a bullish trend, with the Super Trend showing a bullish trend and the Resistance Breakout confirming this trend by showing the price breaking above a key resistance level. Given the alignment of these signals, it may be a good idea to consider entering a long position and targeting higher levels. Our analysis indicates that the key resistance levels are at 0.001123 | 0.001189 | 0.001334 and the major support zones are at 0.000978 | 0.000899 | 0.000754. However, it is important to also consider other factors such as overall market conditions and other technical indicators before making a trade decision.
📊 Technical Metrics Index Summary:
⎿ Mrkt Price ⌁ 0.001103 ₿⎿ 24hChng: 🚀 6.058%⎿ 24hVol: 11.004 ₿⎿ Osciltrs: SELL⎿ MAs: STRONG_BUY🚥 Market Sentiment Index:
⎿ News: N/A⎿ Twitter: 0.65 - Bullish⎿ Reddit: 0.50 - Bearish* Curated by MPDBreakout System.
* Unlock Trading Signal below.
📚 New Technical analysis for [ Ambire AdEx ]
🎯 #ADX/BTC
🪄 ADX Chart ➖ Tradingview Idea
🔸 We've detected a Resistance Breakout and Confirmation on the $ADX / $BTC chart. The price has broken above a key resistance level and has been confirmed by a strong candle, indicating a potential bullish trend. The next resistance key levels are at 0.00000889 | 0.00000977 | 0.00001128 and the major support zones are respectively at 0.00000738 | 0.00000675 | 0.00000524. We may consider entering a trade at the current price zone at 0.00000867 and targetting higher levels.
📊 Technical Metrics Index Summary:
🚥 Market Sentiment Index:
* Curated by MPDBreakout System.
* Unlock Trading Signal below.
🎯 #ADX/BTC
🪄 ADX Chart ➖ Tradingview Idea
🔸 We've detected a Resistance Breakout and Confirmation on the $ADX / $BTC chart. The price has broken above a key resistance level and has been confirmed by a strong candle, indicating a potential bullish trend. The next resistance key levels are at 0.00000889 | 0.00000977 | 0.00001128 and the major support zones are respectively at 0.00000738 | 0.00000675 | 0.00000524. We may consider entering a trade at the current price zone at 0.00000867 and targetting higher levels.
📊 Technical Metrics Index Summary:
⎿ Mrkt Price ⌁ 0.00000867 ₿⎿ 24hChng: 🔺 4.458%⎿ 24hVol: 29.971 ₿⎿ Osciltrs: NEUTRAL⎿ MAs: STRONG_BUY🚥 Market Sentiment Index:
⎿ News: N/A⎿ Twitter: 0.57 - Bullish⎿ Reddit: 0.77 - Very Bullish* Curated by MPDBreakout System.
* Unlock Trading Signal below.
📚 New Technical analysis for [ Origin Protocol ]
🎯 #OGN/BTC
🪄 OGN Chart ➖ Tradingview Idea
🔸 Hey traders, we've identified a Resistance Breakout on the $OGN / $BTC chart. The price has broken above a key resistance level, which can indicate a potential bullish trend. Taking in consideration the next resistance key levels are at 0.00000721 | 0.00000822 | 0.00000999 and the major support zones are respectively at 0.00000544 | 0.00000468 | 0.00000291. It is a bullish indication and we may consider entering at the current price zone at 0.00000633 and targetting higher levels.
📊 Technical Metrics Index Summary:
* Unlock Trading Signal below.
🎯 #OGN/BTC
🪄 OGN Chart ➖ Tradingview Idea
🔸 Hey traders, we've identified a Resistance Breakout on the $OGN / $BTC chart. The price has broken above a key resistance level, which can indicate a potential bullish trend. Taking in consideration the next resistance key levels are at 0.00000721 | 0.00000822 | 0.00000999 and the major support zones are respectively at 0.00000544 | 0.00000468 | 0.00000291. It is a bullish indication and we may consider entering at the current price zone at 0.00000633 and targetting higher levels.
📊 Technical Metrics Index Summary:
⎿  Mrkt Price ⌁ 0.00000633 ₿
⎿  24hChng: 🔺 3.601%
⎿  24hVol: 9.767 ₿
⎿  Osciltrs: NEUTRAL
⎿  MAs: STRONG_BUY
🚥 Market Sentiment Index:⎿ News: N/A
⎿ Twitter: 0.75 - Bullish
⎿ Reddit: 0.63 - Bullish
* Curated by MPDBreakout System.* Unlock Trading Signal below.