
Uniswap poll shows 80% support decentralized crypto exchange's move to BNB chain — link
CoinDesk
Uniswap Poll Shows 80% Support Decentralized Crypto Exchange's Move to BNB Chain
More than 20 million UNI were staked by community members to cast their votes.
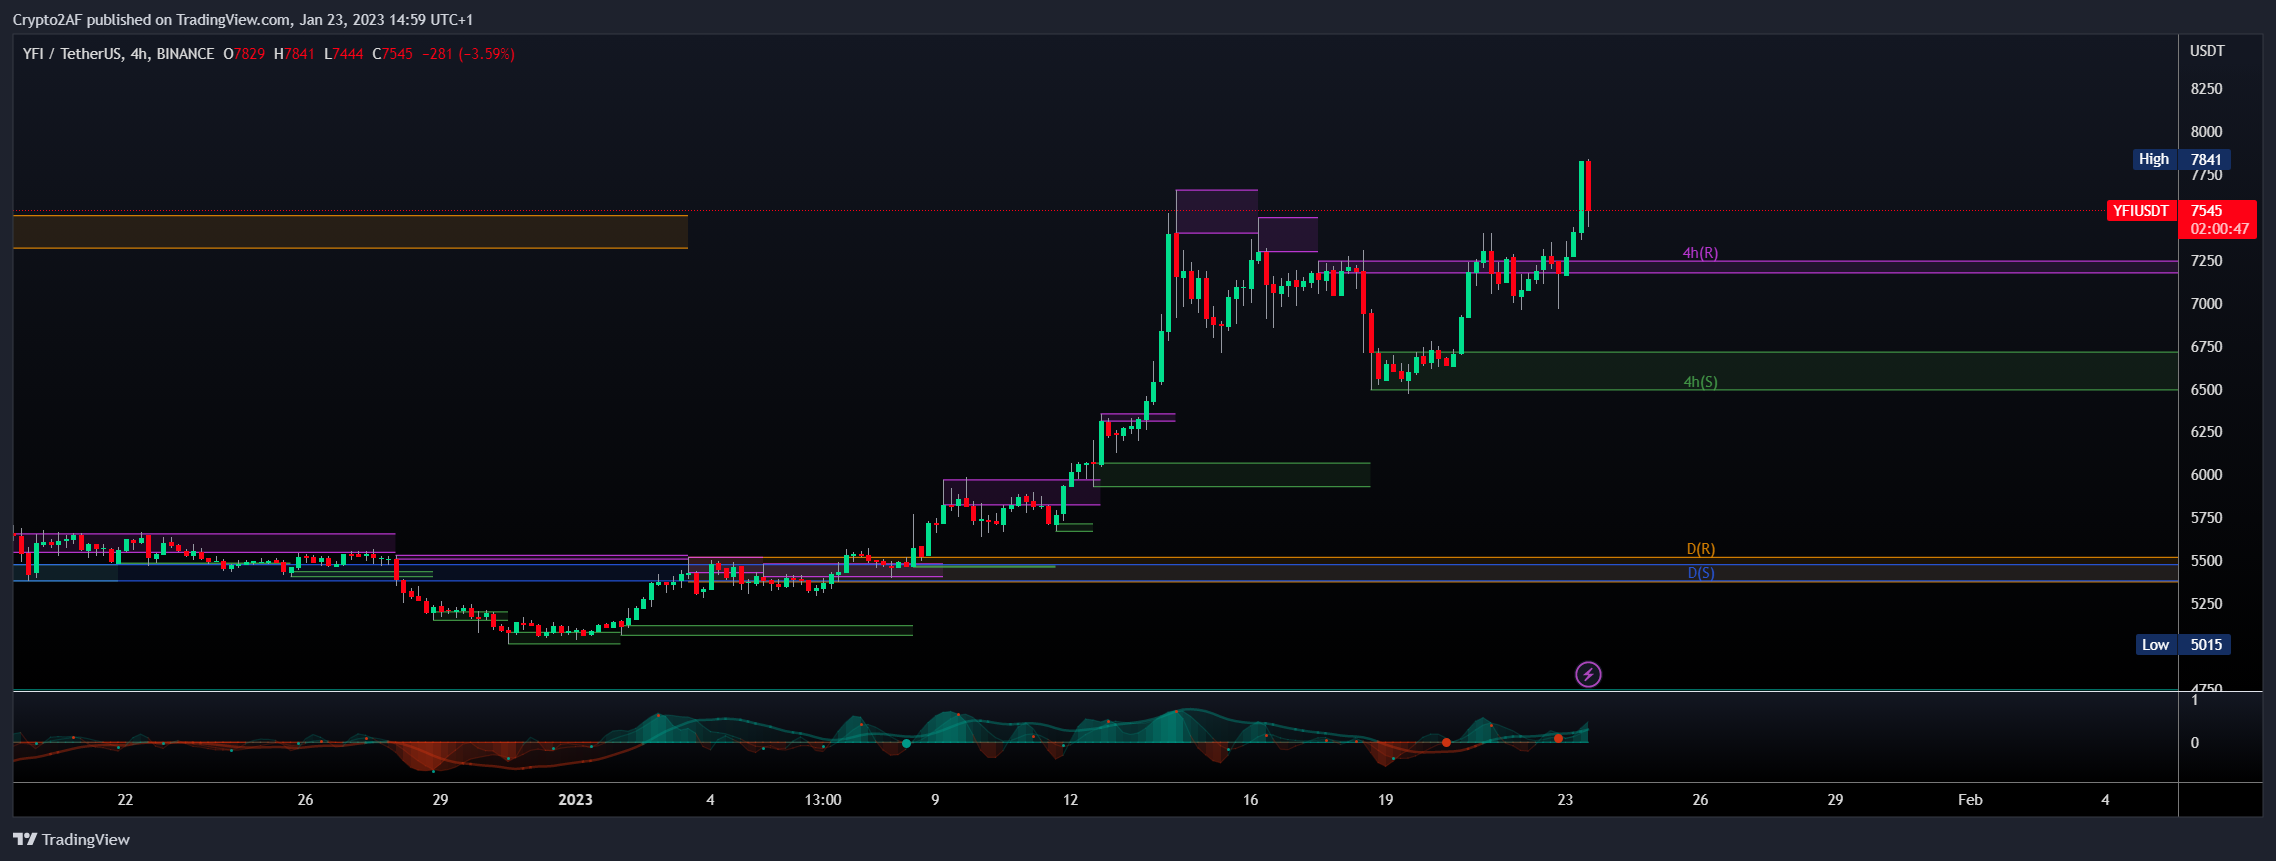
Our Breakout System has detected the following bullish chart patterns:
#YFI/USDT [ yearn.finance ]
• ➤ https://s3.tradingview.com/snapshots/a/aK8M3q7T.png
• 📄 We've detected a Resistance Breakout on the YFI/USDT chart. The price has broken above a key resistance level, which can indicate a potential bullish trend. We may consider buying at the current price zone and targetting higher level.
• 🪄 Trade setup:
• ⎿ 💰 Our Entry: 7,549.00000000
• ⎿ Target 1 : —subscribe to unlock
• ⎿ Target 2 : —subscribe to unlock
• ⎿ Target 3 : —subscribe to unlock
• ⎿ Target 4 : —subscribe to unlock
• 🚫 Stop: —subscribe to unlock
• 📊 Technical indicators:
• ⎿ 24h P. change: 🔺 4.499%
• ⎿ 24h Volume: 7,444,000.918 USDT
• ⎿ Live Chart: Tradingview
• ⎿ TA Metrics: Tradingview TA
• 📚 Chart_Patterns_Guide
[Resistance_Breakout] on:#YFI/USDT [ yearn.finance ]
• ➤ https://s3.tradingview.com/snapshots/a/aK8M3q7T.png
• 📄 We've detected a Resistance Breakout on the YFI/USDT chart. The price has broken above a key resistance level, which can indicate a potential bullish trend. We may consider buying at the current price zone and targetting higher level.
• 🪄 Trade setup:
• ⎿ 💰 Our Entry: 7,549.00000000
• ⎿ Target 1 : —
• ⎿ Target 2 : —
• ⎿ Target 3 : —
• ⎿ Target 4 : —
• 🚫 Stop: —
• 📊 Technical indicators:
• ⎿ 24h P. change: 🔺 4.499%
• ⎿ 24h Volume: 7,444,000.918 USDT
• ⎿ Live Chart: Tradingview
• ⎿ TA Metrics: Tradingview TA
• 📚 Chart_Patterns_Guide
Our Breakout System has detected the following bullish chart patterns:
#FIRO/USDT [ Firo ]
• ➤ https://s3.tradingview.com/snapshots/n/N99l0bw2.png
• 📄 We've detected a Bollinger Band breakout on the FIRO/USDT chart. The price has moved outside of the upper Bollinger Band, which can indicate a potential bullish trend. We may consider buying at the current price zone and targetting higher level.
• 🪄 Trade setup:
• ⎿ 💰 Our Entry: 1.99500000
• ⎿ Target 1 : —subscribe to unlock
• ⎿ Target 2 : —subscribe to unlock
• ⎿ Target 3 : —subscribe to unlock
• ⎿ Target 4 : —subscribe to unlock
• 🚫 Stop: —subscribe to unlock
• 📊 Technical indicators:
• ⎿ 24h P. change: 🔺 1.786%
• ⎿ 24h Volume: 1,576,312.326 USDT
• ⎿ Live Chart: Tradingview
• ⎿ TA Metrics: Tradingview TA
• 📚 Chart_Patterns_Guide
[Bollinger_Breakout] on:#FIRO/USDT [ Firo ]
• ➤ https://s3.tradingview.com/snapshots/n/N99l0bw2.png
• 📄 We've detected a Bollinger Band breakout on the FIRO/USDT chart. The price has moved outside of the upper Bollinger Band, which can indicate a potential bullish trend. We may consider buying at the current price zone and targetting higher level.
• 🪄 Trade setup:
• ⎿ 💰 Our Entry: 1.99500000
• ⎿ Target 1 : —
• ⎿ Target 2 : —
• ⎿ Target 3 : —
• ⎿ Target 4 : —
• 🚫 Stop: —
• 📊 Technical indicators:
• ⎿ 24h P. change: 🔺 1.786%
• ⎿ 24h Volume: 1,576,312.326 USDT
• ⎿ Live Chart: Tradingview
• ⎿ TA Metrics: Tradingview TA
• 📚 Chart_Patterns_Guide
Our Breakout System has detected the following bullish chart patterns:
#EPX/USDT [ Ellipsis ]
• ➤ https://s3.tradingview.com/snapshots/h/HeOD0CPg.png
• 📄 We've detected a Bollinger Band breakout on the EPX/USDT chart. The price has moved outside of the upper Bollinger Band, which can indicate a potential bullish trend. We may consider buying at the current price zone and targetting higher level.
• 🪄 Trade setup:
• ⎿ 💰 Our Entry: 0.00038800
• ⎿ Target 1 : —subscribe to unlock
• ⎿ Target 2 : —subscribe to unlock
• ⎿ Target 3 : —subscribe to unlock
• ⎿ Target 4 : —subscribe to unlock
• 🚫 Stop: —subscribe to unlock
• 📊 Technical indicators:
• ⎿ 24h P. change: 🔺 2.646%
• ⎿ 24h Volume: 1,155,293.030 USDT
• ⎿ Live Chart: Tradingview
• ⎿ TA Metrics: Tradingview TA
• 📚 Chart_Patterns_Guide
[Bollinger_Breakout] on:#EPX/USDT [ Ellipsis ]
• ➤ https://s3.tradingview.com/snapshots/h/HeOD0CPg.png
• 📄 We've detected a Bollinger Band breakout on the EPX/USDT chart. The price has moved outside of the upper Bollinger Band, which can indicate a potential bullish trend. We may consider buying at the current price zone and targetting higher level.
• 🪄 Trade setup:
• ⎿ 💰 Our Entry: 0.00038800
• ⎿ Target 1 : —
• ⎿ Target 2 : —
• ⎿ Target 3 : —
• ⎿ Target 4 : —
• 🚫 Stop: —
• 📊 Technical indicators:
• ⎿ 24h P. change: 🔺 2.646%
• ⎿ 24h Volume: 1,155,293.030 USDT
• ⎿ Live Chart: Tradingview
• ⎿ TA Metrics: Tradingview TA
• 📚 Chart_Patterns_Guide
Our Breakout System has detected the following bullish chart patterns:
#FIO/USDT [ FIO Protocol ]
• ➤ https://s3.tradingview.com/snapshots/k/kPvdothT.png
• 📄 We've detected a Resistance Breakout on the FIO/USDT chart. The price has broken above a key resistance level, which can indicate a potential bullish trend. We may consider buying at the current price zone and targetting higher level.
• 🪄 Trade setup:
• ⎿ 💰 Our Entry: 0.03330000
• ⎿ Target 1 : —subscribe to unlock
• ⎿ Target 2 : —subscribe to unlock
• ⎿ Target 3 : —subscribe to unlock
• ⎿ Target 4 : —subscribe to unlock
• 🚫 Stop: —subscribe to unlock
• 📊 Technical indicators:
• ⎿ 24h P. change: 🔺 2.462%
• ⎿ 24h Volume: 519,364.510 USDT
• ⎿ Live Chart: Tradingview
• ⎿ TA Metrics: Tradingview TA
• 📚 Chart_Patterns_Guide
[Resistance_Breakout] on:#FIO/USDT [ FIO Protocol ]
• ➤ https://s3.tradingview.com/snapshots/k/kPvdothT.png
• 📄 We've detected a Resistance Breakout on the FIO/USDT chart. The price has broken above a key resistance level, which can indicate a potential bullish trend. We may consider buying at the current price zone and targetting higher level.
• 🪄 Trade setup:
• ⎿ 💰 Our Entry: 0.03330000
• ⎿ Target 1 : —
• ⎿ Target 2 : —
• ⎿ Target 3 : —
• ⎿ Target 4 : —
• 🚫 Stop: —
• 📊 Technical indicators:
• ⎿ 24h P. change: 🔺 2.462%
• ⎿ 24h Volume: 519,364.510 USDT
• ⎿ Live Chart: Tradingview
• ⎿ TA Metrics: Tradingview TA
• 📚 Chart_Patterns_Guide
Our Breakout System has detected the following bullish chart patterns:
#TKO/BTC [ Toko Token ]
• ➤ https://s3.tradingview.com/snapshots/y/YnCq4jfc.png
• 📄 We've detected a Descending Triangle pattern on the TKO/BTC chart. The price requires a further strong bullish continuation as an indication of a breakout. A descending triangle provides a useful chart formation that spots that the price will rally further once price breaks through the resistance. TKO/BTC to accomodate to higher level.
• 🪄 Trade setup:
• ⎿ 💰 Our Entry: 0.00001320
• ⎿ Target 1 : —subscribe to unlock
• ⎿ Target 2 : — subscribe to unlock
• ⎿ Target 3 : — subscribe to unlock
• ⎿ Target 4 : — subscribe to unlock
• 🚫 Stop: — subscribe to unlock
• 📊 Technical indicators:
• ⎿ 24h P. change: 🔺 1.227%
• ⎿ 24h Volume: 4.866 BTC
• ⎿ Live Chart: Tradingview
• ⎿ TA Metrics: Tradingview TA
• 📚 Chart_Patterns_Guide
[Ascending_Triangle] on:#TKO/BTC [ Toko Token ]
• ➤ https://s3.tradingview.com/snapshots/y/YnCq4jfc.png
• 📄 We've detected a Descending Triangle pattern on the TKO/BTC chart. The price requires a further strong bullish continuation as an indication of a breakout. A descending triangle provides a useful chart formation that spots that the price will rally further once price breaks through the resistance. TKO/BTC to accomodate to higher level.
• 🪄 Trade setup:
• ⎿ 💰 Our Entry: 0.00001320
• ⎿ Target 1 : —
• ⎿ 24h P. change: 🔺 1.227%
• ⎿ 24h Volume: 4.866 BTC
• ⎿ Live Chart: Tradingview
• ⎿ TA Metrics: Tradingview TA
• 📚 Chart_Patterns_Guide
Our Breakout System has detected the following bullish chart patterns:
#ALPHA/BTC [ Alpha Venture DAO ]
• ➤ https://s3.tradingview.com/snapshots/c/c68nHij1.png
• 📄 We've detected a Bollinger Band breakout on the ALPHA/BTC chart. The price has moved outside of the upper Bollinger Band, which can indicate a potential bullish trend. We may consider buying at the current price zone and targetting higher level.
• 🪄 Trade setup:
• ⎿ 💰 Our Entry: 0.00000599
• ⎿ Target 1 : —subscribe to unlock
• ⎿ Target 2 : —subscribe to unlock
• ⎿ Target 3 : —subscribe to unlock
• ⎿ Target 4 : —subscribe to unlock
• 🚫 Stop: —subscribe to unlock
• 📊 Technical indicators:
• ⎿ 24h P. change: 🔺 8.909%
• ⎿ 24h Volume: 3.372 BTC
• ⎿ Live Chart: Tradingview
• ⎿ TA Metrics: Tradingview TA
• 📚 Chart_Patterns_Guide
[Bollinger_Breakout] on:#ALPHA/BTC [ Alpha Venture DAO ]
• ➤ https://s3.tradingview.com/snapshots/c/c68nHij1.png
• 📄 We've detected a Bollinger Band breakout on the ALPHA/BTC chart. The price has moved outside of the upper Bollinger Band, which can indicate a potential bullish trend. We may consider buying at the current price zone and targetting higher level.
• 🪄 Trade setup:
• ⎿ 💰 Our Entry: 0.00000599
• ⎿ Target 1 : —
• ⎿ Target 2 : —
• ⎿ Target 3 : —
• ⎿ Target 4 : —
• 🚫 Stop: —
• 📊 Technical indicators:
• ⎿ 24h P. change: 🔺 8.909%
• ⎿ 24h Volume: 3.372 BTC
• ⎿ Live Chart: Tradingview
• ⎿ TA Metrics: Tradingview TA
• 📚 Chart_Patterns_Guide
According to Coindesk, over 29,000 crypto jobs have been lost as of January 17 this year — link
Our Breakout System has detected the following bullish chart patterns:
#KDA/BTC [ Kadena ]
•➡️ https://s3.tradingview.com/snapshots/p/PHnXFGP2.png
•📝 🪄 We've detected a Resistance Breakout and Confirmation on the KDA/BTC chart. The price has broken above a key resistance level and has been confirmed by a strong candle, indicating a potential bullish trend. We may consider buying at the current price zone and targetting higher level.
• 🪄 Trade setup:
• ⎿ 💰 Our Entry: 0.00005660
• ⎿ Target 1 : —subscribe to unlock
• ⎿ Target 2 : — subscribe to unlock
• ⎿ Target 3 : — subscribe to unlock
• ⎿ Target 4 : — subscribe to unlock
• 🚫 Stop: — subscribe to unlock
• 📊 Technical indicators:
• ⎿ 24h P. change: 🔺 5.993%
• ⎿ 24h Volume: 38.887 BTC
• ⎿ Live Chart: Tradingview
• ⎿ TA Metrics: Tradingview TA
• 📚 Chart_Patterns_Guide
[Resistance_Breakout_+_Confirmation] on:#KDA/BTC [ Kadena ]
•
•
• 🪄 Trade setup:
• ⎿ 💰 Our Entry: 0.00005660
• ⎿ Target 1 : —
• ⎿ 24h P. change: 🔺 5.993%
• ⎿ 24h Volume: 38.887 BTC
• ⎿ Live Chart: Tradingview
• ⎿ TA Metrics: Tradingview TA
• 📚 Chart_Patterns_Guide
Please open Telegram to view this post
VIEW IN TELEGRAM
Please open Telegram to view this post
VIEW IN TELEGRAM
Swiss Bank Cité Gestion becomes first private bank to tokenize its own shares — link
CoinDesk
Swiss Bank Cité Gestion Becomes First Private Bank to Tokenize Its Own Shares
The private bank is partnering with digital assets firm Taurus to issue and manage its tokenized shares.
EU lawmakers impose ‘prohibitive’ requirements on banks holding crypto — link
CoinDesk
EU Lawmakers Impose ‘Prohibitive’ Requirements on Banks’ Crypto Holdings
The vote in the European Parliament's Economic and Monetary Affairs Committee is intended to anticipate international bank-capital norms.
Our Breakout System has detected the following bullish chart patterns:
#SCRT/USDT [ Secret ]
• 📈 https://s3.tradingview.com/snapshots/a/aA4dwgUv.png
• We've detected a Bollinger Band breakout on the SCRT/USDT chart. The price has moved outside of the upper Bollinger Band, which can indicate a potential bullish trend. We may consider buying at the current price zone and targetting higher level.
• 🪄 Trade setup:
• ⎿ 💰 Our Entry: 0.81600000
• ⎿ Target 1 : —subscribe to unlock
• ⎿ Target 2 : —subscribe to unlock
• ⎿ Target 3 : —subscribe to unlock
• ⎿ Target 4 : —subscribe to unlock
• 🚫 Stop: —subscribe to unlock
• 📊 Technical indicators:
• ⎿ 24h P. change: 🔺 0.246%
• ⎿ 24h Volume: 926,426.078 USDT
• ⎿ Live Chart: Tradingview
• ⎿ TA Metrics: Tradingview TA
• 📚 Chart_Patterns_Guide
[Bollinger_Breakout] on:#SCRT/USDT [ Secret ]
• 📈 https://s3.tradingview.com/snapshots/a/aA4dwgUv.png
• We've detected a Bollinger Band breakout on the SCRT/USDT chart. The price has moved outside of the upper Bollinger Band, which can indicate a potential bullish trend. We may consider buying at the current price zone and targetting higher level.
• 🪄 Trade setup:
• ⎿ 💰 Our Entry: 0.81600000
• ⎿ Target 1 : —
• ⎿ Target 2 : —
• ⎿ Target 3 : —
• ⎿ Target 4 : —
• 🚫 Stop: —
• 📊 Technical indicators:
• ⎿ 24h P. change: 🔺 0.246%
• ⎿ 24h Volume: 926,426.078 USDT
• ⎿ Live Chart: Tradingview
• ⎿ TA Metrics: Tradingview TA
• 📚 Chart_Patterns_Guide
Our Breakout System has detected the following bullish chart patterns:
#DOCK/USDT [ Dock ]
• 📈 https://s3.tradingview.com/snapshots/g/g45zCkNq.png
• We've detected a Super Trend pattern on the DOCK/USDT chart. The Super Trend indicator is showing a bearish trend, indicating a potential trend reversal. We may consider entering at this levele and benefit from the trend continuation.
• 🪄 Trade setup:
• ⎿ 💰 Our Entry: 0.01902000
• ⎿ Target 1 : —subscribe to unlock
• ⎿ Target 2 : —subscribe to unlock
• ⎿ Target 3 : —subscribe to unlock
• ⎿ Target 4 : —subscribe to unlock
• 🚫 Stop: —subscribe to unlock
• 📊 Technical indicators:
• ⎿ 24h P. change: 🔺 2.478%
• ⎿ 24h Volume: 330,404.921 USDT
• ⎿ Live Chart: Tradingview
• ⎿ TA Metrics: Tradingview TA
• 📚 Chart_Patterns_Guide
[Super_Trend] on:#DOCK/USDT [ Dock ]
• 📈 https://s3.tradingview.com/snapshots/g/g45zCkNq.png
• We've detected a Super Trend pattern on the DOCK/USDT chart. The Super Trend indicator is showing a bearish trend, indicating a potential trend reversal. We may consider entering at this levele and benefit from the trend continuation.
• 🪄 Trade setup:
• ⎿ 💰 Our Entry: 0.01902000
• ⎿ Target 1 : —
• ⎿ Target 2 : —
• ⎿ Target 3 : —
• ⎿ Target 4 : —
• 🚫 Stop: —
• 📊 Technical indicators:
• ⎿ 24h P. change: 🔺 2.478%
• ⎿ 24h Volume: 330,404.921 USDT
• ⎿ Live Chart: Tradingview
• ⎿ TA Metrics: Tradingview TA
• 📚 Chart_Patterns_Guide
Peers unite. Never use a middleman again to chat.
Download Keet.io - Never on a server.*
Download Keet.io - Never on a server.*
Our Breakout System has detected the following bullish chart patterns:
#LSK/USDT [ Lisk ]
• 📈 https://s3.tradingview.com/snapshots/u/UCDEsKVQ.png
• We've detected a Resistance Breakout and Confirmation on the LSK/USDT chart. The price has broken above a key resistance level and has been confirmed by a strong candle, indicating a potential bullish trend. We may consider buying at the current price zone and targetting higher level.
• 🪄 Trade setup:
• ⎿ 💰 Our Entry: 0.96300000
• ⎿ Target 1 : —subscribe to unlock
• ⎿ Target 2 : —subscribe to unlock
• ⎿ Target 3 : —subscribe to unlock
• ⎿ Target 4 : —subscribe to unlock
• 🚫 Stop: —subscribe to unlock
• 📊 Technical indicators:
• ⎿ 24h P. change: 🔺 5.016%
• ⎿ 24h Volume: 621,447.508 USDT
• ⎿ Live Chart: Tradingview
• ⎿ TA Metrics: Tradingview TA
• 📚 Chart_Patterns_Guide
[Resistance_Breakout_+_Confirmation] on:#LSK/USDT [ Lisk ]
• 📈 https://s3.tradingview.com/snapshots/u/UCDEsKVQ.png
• We've detected a Resistance Breakout and Confirmation on the LSK/USDT chart. The price has broken above a key resistance level and has been confirmed by a strong candle, indicating a potential bullish trend. We may consider buying at the current price zone and targetting higher level.
• 🪄 Trade setup:
• ⎿ 💰 Our Entry: 0.96300000
• ⎿ Target 1 : —
• ⎿ Target 2 : —
• ⎿ Target 3 : —
• ⎿ Target 4 : —
• 🚫 Stop: —
• 📊 Technical indicators:
• ⎿ 24h P. change: 🔺 5.016%
• ⎿ 24h Volume: 621,447.508 USDT
• ⎿ Live Chart: Tradingview
• ⎿ TA Metrics: Tradingview TA
• 📚 Chart_Patterns_Guide
Our Breakout System has detected the following bullish chart patterns:
#BNT/USDT [ Bancor ]
• 📈 https://s3.tradingview.com/snapshots/r/RW0e3046.png
• We've detected a Resistance Breakout and Confirmation on the BNT/USDT chart. The price has broken above a key resistance level and has been confirmed by a strong candle, indicating a potential bullish trend. We may consider buying at the current price zone and targetting higher level.
• 🪄 Trade setup:
• ⎿ 💰 Our Entry: 0.42700000
• ⎿ Target 1 : —subscribe to unlock
• ⎿ Target 2 : —subscribe to unlock
• ⎿ Target 3 : —subscribe to unlock
• ⎿ Target 4 : —subscribe to unlock
• 🚫 Stop: —subscribe to unlock
• 📊 Technical indicators:
• ⎿ 24h P. change: 🔺 0.946%
• ⎿ 24h Volume: 562,199.026 USDT
• ⎿ Live Chart: Tradingview
• ⎿ TA Metrics: Tradingview TA
• 📚 Chart_Patterns_Guide
[Resistance_Breakout_+_Confirmation] on:#BNT/USDT [ Bancor ]
• 📈 https://s3.tradingview.com/snapshots/r/RW0e3046.png
• We've detected a Resistance Breakout and Confirmation on the BNT/USDT chart. The price has broken above a key resistance level and has been confirmed by a strong candle, indicating a potential bullish trend. We may consider buying at the current price zone and targetting higher level.
• 🪄 Trade setup:
• ⎿ 💰 Our Entry: 0.42700000
• ⎿ Target 1 : —
• ⎿ Target 2 : —
• ⎿ Target 3 : —
• ⎿ Target 4 : —
• 🚫 Stop: —
• 📊 Technical indicators:
• ⎿ 24h P. change: 🔺 0.946%
• ⎿ 24h Volume: 562,199.026 USDT
• ⎿ Live Chart: Tradingview
• ⎿ TA Metrics: Tradingview TA
• 📚 Chart_Patterns_Guide
Our Breakout System has detected the following bullish chart patterns:
#OMG/USDT [ OMG Network ]
• 📈 https://s3.tradingview.com/snapshots/a/ak8oDti0.png
• We've detected a Resistance Breakout and Confirmation on the OMG/USDT chart. The price has broken above a key resistance level and has been confirmed by a strong candle, indicating a potential bullish trend. We may consider buying at the current price zone and targetting higher level.
• 🪄 Trade setup:
• ⎿ 💰 Our Entry: 1.48100000
• ⎿ Target 1 : —subscribe to unlock
• ⎿ Target 2 : —subscribe to unlock
• ⎿ Target 3 : —subscribe to unlock
• ⎿ Target 4 : —subscribe to unlock
• 🚫 Stop: —subscribe to unlock
• 📊 Technical indicators:
• ⎿ 24h P. change: 🔺 5.185%
• ⎿ 24h Volume: 6,397,939.178 USDT
• ⎿ Live Chart: Tradingview
• ⎿ TA Metrics: Tradingview TA
• 📚 Chart_Patterns_Guide
[Resistance_Breakout_+_Confirmation] on:#OMG/USDT [ OMG Network ]
• 📈 https://s3.tradingview.com/snapshots/a/ak8oDti0.png
• We've detected a Resistance Breakout and Confirmation on the OMG/USDT chart. The price has broken above a key resistance level and has been confirmed by a strong candle, indicating a potential bullish trend. We may consider buying at the current price zone and targetting higher level.
• 🪄 Trade setup:
• ⎿ 💰 Our Entry: 1.48100000
• ⎿ Target 1 : —
• ⎿ Target 2 : —
• ⎿ Target 3 : —
• ⎿ Target 4 : —
• 🚫 Stop: —
• 📊 Technical indicators:
• ⎿ 24h P. change: 🔺 5.185%
• ⎿ 24h Volume: 6,397,939.178 USDT
• ⎿ Live Chart: Tradingview
• ⎿ TA Metrics: Tradingview TA
• 📚 Chart_Patterns_Guide
Our Breakout System has detected the following bullish chart patterns:
#WAXP/BTC [ WAX ]
• 📈 https://s3.tradingview.com/snapshots/p/PSDeWtWG.png
• We've detected a Failure Swing pattern on the WAXP/BTC chart. This pattern is a bullish indication and could indicate a potential trend reversal. We may consider buying at the resistance level at the current price.
• 🪄 Trade setup:
• ⎿ 💰 Our Entry: 0.00000322
• ⎿ Target 1 : —subscribe to unlock
• ⎿ Target 2 : —subscribe to unlock
• ⎿ Target 3 : —subscribe to unlock
• ⎿ Target 4 : —subscribe to unlock
• 🚫 Stop: —subscribe to unlock
• 📊 Technical indicators:
• ⎿ 24h P. change: 🔺 9.898%
• ⎿ 24h Volume: 25.897 BTC
• ⎿ Live Chart: Tradingview
• ⎿ TA Metrics: Tradingview TA
• 📚 Chart_Patterns_Guide
[Failure_Swing] on:#WAXP/BTC [ WAX ]
• 📈 https://s3.tradingview.com/snapshots/p/PSDeWtWG.png
• We've detected a Failure Swing pattern on the WAXP/BTC chart. This pattern is a bullish indication and could indicate a potential trend reversal. We may consider buying at the resistance level at the current price.
• 🪄 Trade setup:
• ⎿ 💰 Our Entry: 0.00000322
• ⎿ Target 1 : —
• ⎿ Target 2 : —
• ⎿ Target 3 : —
• ⎿ Target 4 : —
• 🚫 Stop: —
• 📊 Technical indicators:
• ⎿ 24h P. change: 🔺 9.898%
• ⎿ 24h Volume: 25.897 BTC
• ⎿ Live Chart: Tradingview
• ⎿ TA Metrics: Tradingview TA
• 📚 Chart_Patterns_Guide