
Our Breakout System has detected the following bullish chart patterns:
#AXS/USDT [ Axie Infinity ]
• ➤ https://s3.tradingview.com/snapshots/n/NyYPn47p.png
• 📄 : Technical analysis to be included soon, stay tuned!
• 🪄 Trade setup:
• ⎿ 💰 Our Entry: 10.21000000
• ⎿ Target 1 : —subscribe to unlock
• ⎿ Target 2 : —subscribe to unlock
• ⎿ Target 3 : —subscribe to unlock
• ⎿ Target 4 : —subscribe to unlock
• 🚫 Stop: —subscribe to unlock
• 📊 Technical indicators:
• ⎿ 24h P. change: 🔺 10.378%
• ⎿ 24h Volume: 23,702,012.441 USDT
• ⎿ Live Chart: Tradingview
• ⎿ TA Metrics: Tradingview TA
• 📚 Chart_Patterns_Guide
[Bollinger_Breakout - Trend_Reversal] on:#AXS/USDT [ Axie Infinity ]
• ➤ https://s3.tradingview.com/snapshots/n/NyYPn47p.png
• 📄 : Technical analysis to be included soon, stay tuned!
• 🪄 Trade setup:
• ⎿ 💰 Our Entry: 10.21000000
• ⎿ Target 1 : —
• ⎿ Target 2 : —
• ⎿ Target 3 : —
• ⎿ Target 4 : —
• 🚫 Stop: —
• 📊 Technical indicators:
• ⎿ 24h P. change: 🔺 10.378%
• ⎿ 24h Volume: 23,702,012.441 USDT
• ⎿ Live Chart: Tradingview
• ⎿ TA Metrics: Tradingview TA
• 📚 Chart_Patterns_Guide
Our Breakout System has detected the following bullish chart patterns:
#CTK/USDT [ Shentu ]
• ➤ https://s3.tradingview.com/snapshots/r/ruR6cqky.png
• 📄 We've detected a Resistance Breakout and Confirmation on the CTK/USDT chart. The price has broken above a key resistance level and has been confirmed by a strong candle, indicating a potential bullish trend. We may consider buying at the current price zone and targetting higher level.
• 🪄 Trade setup:
• ⎿ 💰 Our Entry: 0.79700000
• ⎿ Target 1 : —subscribe to unlock
• ⎿ Target 2 : —subscribe to unlock
• ⎿ Target 3 : —subscribe to unlock
• ⎿ Target 4 : —subscribe to unlock
• 🚫 Stop: —subscribe to unlock
• 📊 Technical indicators:
• ⎿ 24h P. change: 🔺 1.271%
• ⎿ 24h Volume: 1,029,529.885 USDT
• ⎿ Live Chart: Tradingview
• ⎿ TA Metrics: Tradingview TA
• 📚 Chart_Patterns_Guide
[Resistance_Breakout_+_Confirmation] on:#CTK/USDT [ Shentu ]
• ➤ https://s3.tradingview.com/snapshots/r/ruR6cqky.png
• 📄 We've detected a Resistance Breakout and Confirmation on the CTK/USDT chart. The price has broken above a key resistance level and has been confirmed by a strong candle, indicating a potential bullish trend. We may consider buying at the current price zone and targetting higher level.
• 🪄 Trade setup:
• ⎿ 💰 Our Entry: 0.79700000
• ⎿ Target 1 : —
• ⎿ Target 2 : —
• ⎿ Target 3 : —
• ⎿ Target 4 : —
• 🚫 Stop: —
• 📊 Technical indicators:
• ⎿ 24h P. change: 🔺 1.271%
• ⎿ 24h Volume: 1,029,529.885 USDT
• ⎿ Live Chart: Tradingview
• ⎿ TA Metrics: Tradingview TA
• 📚 Chart_Patterns_Guide
Signature Bank will not handle transactions of less than $100k for Binance customers — link
CoinDesk
Binance Says Signature Bank Won’t Support Transactions for Crypto Exchange Customers of Less Than $100K
The crypto-friendly bank has been reducing its involvement in digital asset markets in recent weeks, part of the ongoing fallout from recent crypto industry debacles.
Our Breakout System has detected the following bullish chart patterns:
#C98/BTC [ Coin98 ]
• ➤ https://s3.tradingview.com/snapshots/j/jqZ2SCuU.png
• 📄 Technical analysis to be included soon, stay tuned!
• 🪄 Trade setup:
• ⎿ 💰 Our Entry: 0.00001044
• ⎿ Target 1 : —subscribe to unlock
• ⎿ Target 2 : —subscribe to unlock
• ⎿ Target 3 : —subscribe to unlock
• ⎿ Target 4 : —subscribe to unlock
• 🚫 Stop: —subscribe to unlock
• 📊 Technical indicators:
• ⎿ 24h P. change: 🔺 0.87%
• ⎿ 24h Volume: 9.000 BTC
• ⎿ Live Chart: Tradingview
• ⎿ TA Metrics: Tradingview TA
• 📚 Chart_Patterns_Guide
[Resistance_Breakout_+_Confirmation - Failure_Swing] on:#C98/BTC [ Coin98 ]
• ➤ https://s3.tradingview.com/snapshots/j/jqZ2SCuU.png
• 📄 Technical analysis to be included soon, stay tuned!
• 🪄 Trade setup:
• ⎿ 💰 Our Entry: 0.00001044
• ⎿ Target 1 : —
• ⎿ Target 2 : —
• ⎿ Target 3 : —
• ⎿ Target 4 : —
• 🚫 Stop: —
• 📊 Technical indicators:
• ⎿ 24h P. change: 🔺 0.87%
• ⎿ 24h Volume: 9.000 BTC
• ⎿ Live Chart: Tradingview
• ⎿ TA Metrics: Tradingview TA
• 📚 Chart_Patterns_Guide
Our Breakout System has detected the following bullish chart patterns:
#XEC/USDT [ eCash ]
• ➤ https://s3.tradingview.com/snapshots/5/51P5F2B3.png
• 📄 We've detected a Bollinger Band breakout on the XEC/USDT chart. The price has moved outside of the upper Bollinger Band, which can indicate a potential bullish trend. We may consider buying at the current price zone and targetting higher level.
• 🪄 Trade setup:
• ⎿ 💰 Our Entry: 0.00003254
• ⎿ Target 1 : —subscribe to unlock
• ⎿ Target 2 : —subscribe to unlock
• ⎿ Target 3 : —subscribe to unlock
• ⎿ Target 4 : —subscribe to unlock
• 🚫 Stop: —subscribe to unlock
• 📊 Technical indicators:
• ⎿ 24h P. change: 🔺 7.82%
• ⎿ 24h Volume: 3,708,891.710 USDT
• ⎿ Live Chart: Tradingview
• ⎿ TA Metrics: Tradingview TA
• 📚 Chart_Patterns_Guide
[Bollinger_Breakout] on:#XEC/USDT [ eCash ]
• ➤ https://s3.tradingview.com/snapshots/5/51P5F2B3.png
• 📄 We've detected a Bollinger Band breakout on the XEC/USDT chart. The price has moved outside of the upper Bollinger Band, which can indicate a potential bullish trend. We may consider buying at the current price zone and targetting higher level.
• 🪄 Trade setup:
• ⎿ 💰 Our Entry: 0.00003254
• ⎿ Target 1 : —
• ⎿ Target 2 : —
• ⎿ Target 3 : —
• ⎿ Target 4 : —
• 🚫 Stop: —
• 📊 Technical indicators:
• ⎿ 24h P. change: 🔺 7.82%
• ⎿ 24h Volume: 3,708,891.710 USDT
• ⎿ Live Chart: Tradingview
• ⎿ TA Metrics: Tradingview TA
• 📚 Chart_Patterns_Guide
Our Breakout System has detected the following bullish chart patterns:
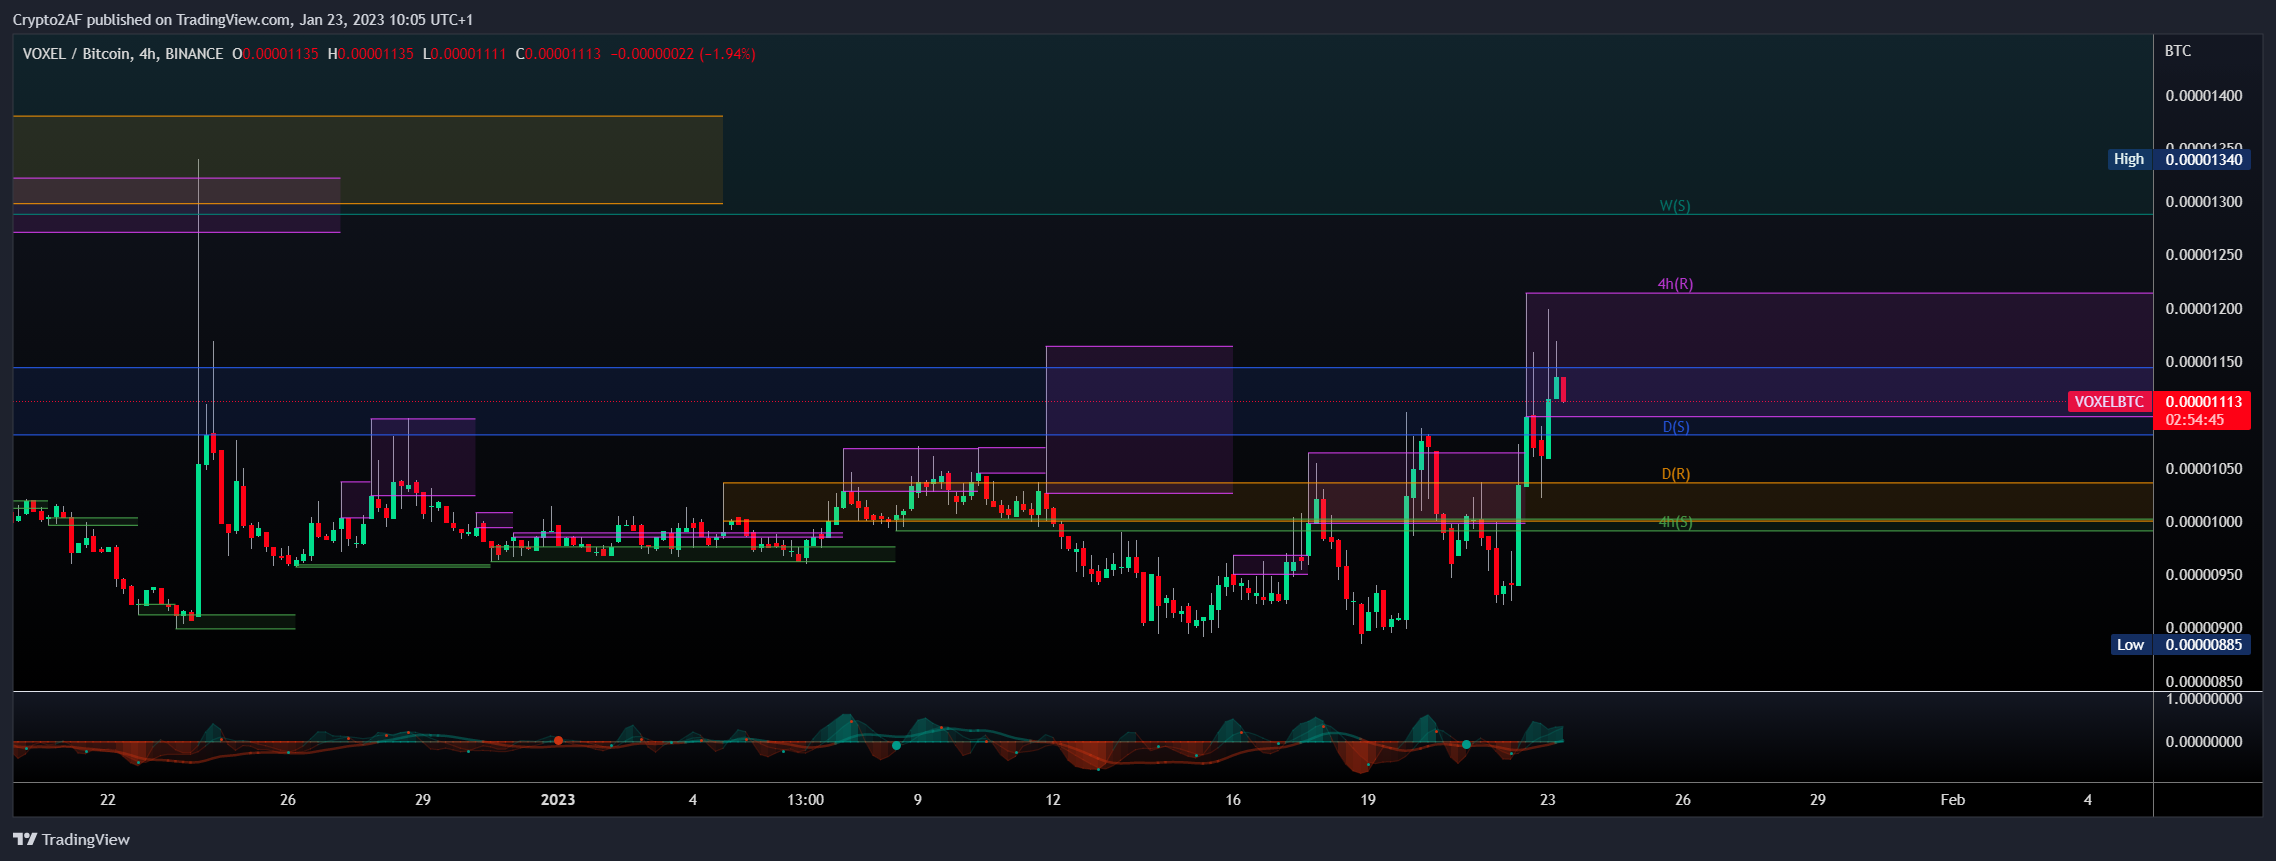
#VOXEL/BTC [ Voxies ]
• ➤ https://s3.tradingview.com/snapshots/w/wWb6nYwT.png
• 📄 We've detected a Resistance Breakout and Confirmation on the VOXEL/BTC chart. The price has broken above a key resistance level and has been confirmed by a strong candle, indicating a potential bullish trend. We may consider buying at the current price zone and targetting higher level.
• 🪄 Trade setup:
• ⎿ 💰 Our Entry: 0.00001113
• ⎿ Target 1 : —subscribe to unlock
• ⎿ Target 2 : —subscribe to unlock
• ⎿ Target 3 : —subscribe to unlock
• ⎿ Target 4 : —subscribe to unlock
• 🚫 Stop: —subscribe to unlock
• 📊 Technical indicators:
• ⎿ 24h P. change: 🔺 14.154%
• ⎿ 24h Volume: 31.780 BTC
• ⎿ Live Chart: Tradingview
• ⎿ TA Metrics: Tradingview TA
• 📚 Chart_Patterns_Guide
[Resistance_Breakout_+_Confirmation] on:#VOXEL/BTC [ Voxies ]
• ➤ https://s3.tradingview.com/snapshots/w/wWb6nYwT.png
• 📄 We've detected a Resistance Breakout and Confirmation on the VOXEL/BTC chart. The price has broken above a key resistance level and has been confirmed by a strong candle, indicating a potential bullish trend. We may consider buying at the current price zone and targetting higher level.
• 🪄 Trade setup:
• ⎿ 💰 Our Entry: 0.00001113
• ⎿ Target 1 : —
• ⎿ Target 2 : —
• ⎿ Target 3 : —
• ⎿ Target 4 : —
• 🚫 Stop: —
• 📊 Technical indicators:
• ⎿ 24h P. change: 🔺 14.154%
• ⎿ 24h Volume: 31.780 BTC
• ⎿ Live Chart: Tradingview
• ⎿ TA Metrics: Tradingview TA
• 📚 Chart_Patterns_Guide
Digital asset investment products saw US$37m inflows last week, although this was predominantly into short investment products (68%).Total assets under management after recent price appreciation is now at US$29bn, the highest since September 2022 — link
The current bear market is fairly on track with previous bears — link
Uniswap poll shows 80% support decentralized crypto exchange's move to BNB chain — link
CoinDesk
Uniswap Poll Shows 80% Support Decentralized Crypto Exchange's Move to BNB Chain
More than 20 million UNI were staked by community members to cast their votes.
Our Breakout System has detected the following bullish chart patterns:
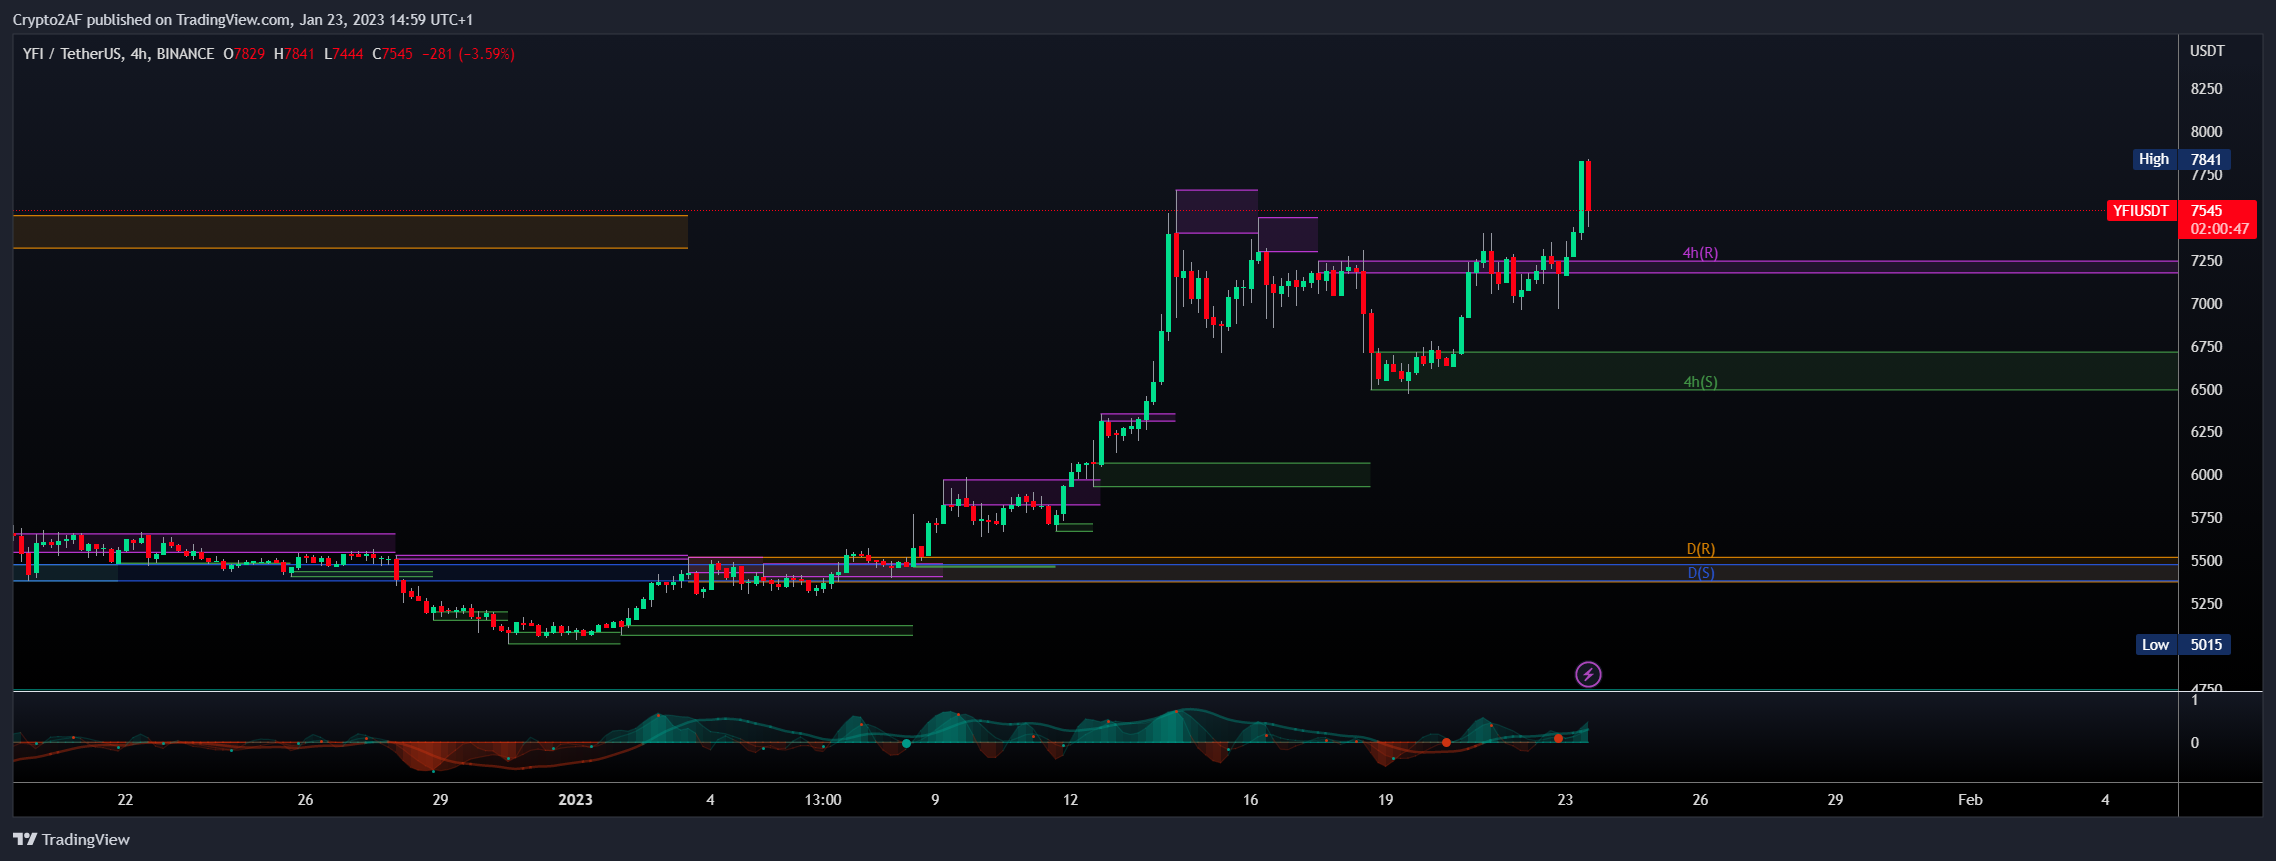
#YFI/USDT [ yearn.finance ]
• ➤ https://s3.tradingview.com/snapshots/a/aK8M3q7T.png
• 📄 We've detected a Resistance Breakout on the YFI/USDT chart. The price has broken above a key resistance level, which can indicate a potential bullish trend. We may consider buying at the current price zone and targetting higher level.
• 🪄 Trade setup:
• ⎿ 💰 Our Entry: 7,549.00000000
• ⎿ Target 1 : —subscribe to unlock
• ⎿ Target 2 : —subscribe to unlock
• ⎿ Target 3 : —subscribe to unlock
• ⎿ Target 4 : —subscribe to unlock
• 🚫 Stop: —subscribe to unlock
• 📊 Technical indicators:
• ⎿ 24h P. change: 🔺 4.499%
• ⎿ 24h Volume: 7,444,000.918 USDT
• ⎿ Live Chart: Tradingview
• ⎿ TA Metrics: Tradingview TA
• 📚 Chart_Patterns_Guide
[Resistance_Breakout] on:#YFI/USDT [ yearn.finance ]
• ➤ https://s3.tradingview.com/snapshots/a/aK8M3q7T.png
• 📄 We've detected a Resistance Breakout on the YFI/USDT chart. The price has broken above a key resistance level, which can indicate a potential bullish trend. We may consider buying at the current price zone and targetting higher level.
• 🪄 Trade setup:
• ⎿ 💰 Our Entry: 7,549.00000000
• ⎿ Target 1 : —
• ⎿ Target 2 : —
• ⎿ Target 3 : —
• ⎿ Target 4 : —
• 🚫 Stop: —
• 📊 Technical indicators:
• ⎿ 24h P. change: 🔺 4.499%
• ⎿ 24h Volume: 7,444,000.918 USDT
• ⎿ Live Chart: Tradingview
• ⎿ TA Metrics: Tradingview TA
• 📚 Chart_Patterns_Guide
Our Breakout System has detected the following bullish chart patterns:
#FIRO/USDT [ Firo ]
• ➤ https://s3.tradingview.com/snapshots/n/N99l0bw2.png
• 📄 We've detected a Bollinger Band breakout on the FIRO/USDT chart. The price has moved outside of the upper Bollinger Band, which can indicate a potential bullish trend. We may consider buying at the current price zone and targetting higher level.
• 🪄 Trade setup:
• ⎿ 💰 Our Entry: 1.99500000
• ⎿ Target 1 : —subscribe to unlock
• ⎿ Target 2 : —subscribe to unlock
• ⎿ Target 3 : —subscribe to unlock
• ⎿ Target 4 : —subscribe to unlock
• 🚫 Stop: —subscribe to unlock
• 📊 Technical indicators:
• ⎿ 24h P. change: 🔺 1.786%
• ⎿ 24h Volume: 1,576,312.326 USDT
• ⎿ Live Chart: Tradingview
• ⎿ TA Metrics: Tradingview TA
• 📚 Chart_Patterns_Guide
[Bollinger_Breakout] on:#FIRO/USDT [ Firo ]
• ➤ https://s3.tradingview.com/snapshots/n/N99l0bw2.png
• 📄 We've detected a Bollinger Band breakout on the FIRO/USDT chart. The price has moved outside of the upper Bollinger Band, which can indicate a potential bullish trend. We may consider buying at the current price zone and targetting higher level.
• 🪄 Trade setup:
• ⎿ 💰 Our Entry: 1.99500000
• ⎿ Target 1 : —
• ⎿ Target 2 : —
• ⎿ Target 3 : —
• ⎿ Target 4 : —
• 🚫 Stop: —
• 📊 Technical indicators:
• ⎿ 24h P. change: 🔺 1.786%
• ⎿ 24h Volume: 1,576,312.326 USDT
• ⎿ Live Chart: Tradingview
• ⎿ TA Metrics: Tradingview TA
• 📚 Chart_Patterns_Guide
Our Breakout System has detected the following bullish chart patterns:
#EPX/USDT [ Ellipsis ]
• ➤ https://s3.tradingview.com/snapshots/h/HeOD0CPg.png
• 📄 We've detected a Bollinger Band breakout on the EPX/USDT chart. The price has moved outside of the upper Bollinger Band, which can indicate a potential bullish trend. We may consider buying at the current price zone and targetting higher level.
• 🪄 Trade setup:
• ⎿ 💰 Our Entry: 0.00038800
• ⎿ Target 1 : —subscribe to unlock
• ⎿ Target 2 : —subscribe to unlock
• ⎿ Target 3 : —subscribe to unlock
• ⎿ Target 4 : —subscribe to unlock
• 🚫 Stop: —subscribe to unlock
• 📊 Technical indicators:
• ⎿ 24h P. change: 🔺 2.646%
• ⎿ 24h Volume: 1,155,293.030 USDT
• ⎿ Live Chart: Tradingview
• ⎿ TA Metrics: Tradingview TA
• 📚 Chart_Patterns_Guide
[Bollinger_Breakout] on:#EPX/USDT [ Ellipsis ]
• ➤ https://s3.tradingview.com/snapshots/h/HeOD0CPg.png
• 📄 We've detected a Bollinger Band breakout on the EPX/USDT chart. The price has moved outside of the upper Bollinger Band, which can indicate a potential bullish trend. We may consider buying at the current price zone and targetting higher level.
• 🪄 Trade setup:
• ⎿ 💰 Our Entry: 0.00038800
• ⎿ Target 1 : —
• ⎿ Target 2 : —
• ⎿ Target 3 : —
• ⎿ Target 4 : —
• 🚫 Stop: —
• 📊 Technical indicators:
• ⎿ 24h P. change: 🔺 2.646%
• ⎿ 24h Volume: 1,155,293.030 USDT
• ⎿ Live Chart: Tradingview
• ⎿ TA Metrics: Tradingview TA
• 📚 Chart_Patterns_Guide
Our Breakout System has detected the following bullish chart patterns:
#FIO/USDT [ FIO Protocol ]
• ➤ https://s3.tradingview.com/snapshots/k/kPvdothT.png
• 📄 We've detected a Resistance Breakout on the FIO/USDT chart. The price has broken above a key resistance level, which can indicate a potential bullish trend. We may consider buying at the current price zone and targetting higher level.
• 🪄 Trade setup:
• ⎿ 💰 Our Entry: 0.03330000
• ⎿ Target 1 : —subscribe to unlock
• ⎿ Target 2 : —subscribe to unlock
• ⎿ Target 3 : —subscribe to unlock
• ⎿ Target 4 : —subscribe to unlock
• 🚫 Stop: —subscribe to unlock
• 📊 Technical indicators:
• ⎿ 24h P. change: 🔺 2.462%
• ⎿ 24h Volume: 519,364.510 USDT
• ⎿ Live Chart: Tradingview
• ⎿ TA Metrics: Tradingview TA
• 📚 Chart_Patterns_Guide
[Resistance_Breakout] on:#FIO/USDT [ FIO Protocol ]
• ➤ https://s3.tradingview.com/snapshots/k/kPvdothT.png
• 📄 We've detected a Resistance Breakout on the FIO/USDT chart. The price has broken above a key resistance level, which can indicate a potential bullish trend. We may consider buying at the current price zone and targetting higher level.
• 🪄 Trade setup:
• ⎿ 💰 Our Entry: 0.03330000
• ⎿ Target 1 : —
• ⎿ Target 2 : —
• ⎿ Target 3 : —
• ⎿ Target 4 : —
• 🚫 Stop: —
• 📊 Technical indicators:
• ⎿ 24h P. change: 🔺 2.462%
• ⎿ 24h Volume: 519,364.510 USDT
• ⎿ Live Chart: Tradingview
• ⎿ TA Metrics: Tradingview TA
• 📚 Chart_Patterns_Guide
Our Breakout System has detected the following bullish chart patterns:
#TKO/BTC [ Toko Token ]
• ➤ https://s3.tradingview.com/snapshots/y/YnCq4jfc.png
• 📄 We've detected a Descending Triangle pattern on the TKO/BTC chart. The price requires a further strong bullish continuation as an indication of a breakout. A descending triangle provides a useful chart formation that spots that the price will rally further once price breaks through the resistance. TKO/BTC to accomodate to higher level.
• 🪄 Trade setup:
• ⎿ 💰 Our Entry: 0.00001320
• ⎿ Target 1 : —subscribe to unlock
• ⎿ Target 2 : — subscribe to unlock
• ⎿ Target 3 : — subscribe to unlock
• ⎿ Target 4 : — subscribe to unlock
• 🚫 Stop: — subscribe to unlock
• 📊 Technical indicators:
• ⎿ 24h P. change: 🔺 1.227%
• ⎿ 24h Volume: 4.866 BTC
• ⎿ Live Chart: Tradingview
• ⎿ TA Metrics: Tradingview TA
• 📚 Chart_Patterns_Guide
[Ascending_Triangle] on:#TKO/BTC [ Toko Token ]
• ➤ https://s3.tradingview.com/snapshots/y/YnCq4jfc.png
• 📄 We've detected a Descending Triangle pattern on the TKO/BTC chart. The price requires a further strong bullish continuation as an indication of a breakout. A descending triangle provides a useful chart formation that spots that the price will rally further once price breaks through the resistance. TKO/BTC to accomodate to higher level.
• 🪄 Trade setup:
• ⎿ 💰 Our Entry: 0.00001320
• ⎿ Target 1 : —
• ⎿ 24h P. change: 🔺 1.227%
• ⎿ 24h Volume: 4.866 BTC
• ⎿ Live Chart: Tradingview
• ⎿ TA Metrics: Tradingview TA
• 📚 Chart_Patterns_Guide
Our Breakout System has detected the following bullish chart patterns:
#ALPHA/BTC [ Alpha Venture DAO ]
• ➤ https://s3.tradingview.com/snapshots/c/c68nHij1.png
• 📄 We've detected a Bollinger Band breakout on the ALPHA/BTC chart. The price has moved outside of the upper Bollinger Band, which can indicate a potential bullish trend. We may consider buying at the current price zone and targetting higher level.
• 🪄 Trade setup:
• ⎿ 💰 Our Entry: 0.00000599
• ⎿ Target 1 : —subscribe to unlock
• ⎿ Target 2 : —subscribe to unlock
• ⎿ Target 3 : —subscribe to unlock
• ⎿ Target 4 : —subscribe to unlock
• 🚫 Stop: —subscribe to unlock
• 📊 Technical indicators:
• ⎿ 24h P. change: 🔺 8.909%
• ⎿ 24h Volume: 3.372 BTC
• ⎿ Live Chart: Tradingview
• ⎿ TA Metrics: Tradingview TA
• 📚 Chart_Patterns_Guide
[Bollinger_Breakout] on:#ALPHA/BTC [ Alpha Venture DAO ]
• ➤ https://s3.tradingview.com/snapshots/c/c68nHij1.png
• 📄 We've detected a Bollinger Band breakout on the ALPHA/BTC chart. The price has moved outside of the upper Bollinger Band, which can indicate a potential bullish trend. We may consider buying at the current price zone and targetting higher level.
• 🪄 Trade setup:
• ⎿ 💰 Our Entry: 0.00000599
• ⎿ Target 1 : —
• ⎿ Target 2 : —
• ⎿ Target 3 : —
• ⎿ Target 4 : —
• 🚫 Stop: —
• 📊 Technical indicators:
• ⎿ 24h P. change: 🔺 8.909%
• ⎿ 24h Volume: 3.372 BTC
• ⎿ Live Chart: Tradingview
• ⎿ TA Metrics: Tradingview TA
• 📚 Chart_Patterns_Guide
According to Coindesk, over 29,000 crypto jobs have been lost as of January 17 this year — link
Our Breakout System has detected the following bullish chart patterns:
#KDA/BTC [ Kadena ]
•➡️ https://s3.tradingview.com/snapshots/p/PHnXFGP2.png
•📝 🪄 We've detected a Resistance Breakout and Confirmation on the KDA/BTC chart. The price has broken above a key resistance level and has been confirmed by a strong candle, indicating a potential bullish trend. We may consider buying at the current price zone and targetting higher level.
• 🪄 Trade setup:
• ⎿ 💰 Our Entry: 0.00005660
• ⎿ Target 1 : —subscribe to unlock
• ⎿ Target 2 : — subscribe to unlock
• ⎿ Target 3 : — subscribe to unlock
• ⎿ Target 4 : — subscribe to unlock
• 🚫 Stop: — subscribe to unlock
• 📊 Technical indicators:
• ⎿ 24h P. change: 🔺 5.993%
• ⎿ 24h Volume: 38.887 BTC
• ⎿ Live Chart: Tradingview
• ⎿ TA Metrics: Tradingview TA
• 📚 Chart_Patterns_Guide
[Resistance_Breakout_+_Confirmation] on:#KDA/BTC [ Kadena ]
•
•
• 🪄 Trade setup:
• ⎿ 💰 Our Entry: 0.00005660
• ⎿ Target 1 : —
• ⎿ 24h P. change: 🔺 5.993%
• ⎿ 24h Volume: 38.887 BTC
• ⎿ Live Chart: Tradingview
• ⎿ TA Metrics: Tradingview TA
• 📚 Chart_Patterns_Guide
Please open Telegram to view this post
VIEW IN TELEGRAM
Please open Telegram to view this post
VIEW IN TELEGRAM
Swiss Bank Cité Gestion becomes first private bank to tokenize its own shares — link
CoinDesk
Swiss Bank Cité Gestion Becomes First Private Bank to Tokenize Its Own Shares
The private bank is partnering with digital assets firm Taurus to issue and manage its tokenized shares.