
Shiba Inu price trades near the resistance line of a falling wedge.If SHIB breaks out on robust volume, price targets include highs of $0.00001.Token holders are pulling assets off exchanges to signal bullish confidence.Shiba Inu (SHIB) is gaining fresh attention from traders as its price appears poised for a breakout, supported by a tightening wedge pattern on the daily chart.The token traded around $0.00000779, slightly up on the day as buyers ramp up pressure amid growing on‑chain accumulation.Data shows Shiba Inu price boasts a bullish technical structure, with analysts noting a potential move higher is on the horizon.Dogecoin, Pepe and Floki are also poised for an uptick.Shiba Inu: current price and market dynamicsAs of late January 2026, Shiba Inu hovers around the 0.0000078 level, trading in a tight range after a recent bounce from near 0.0000075.Recent declines and upticks see the cryptocurrency tracking a long-term falling wedge pattern.The pattern prints each successive low higher than the last and the upper trendline slopes downward.This indicates diminishing selling pressure, signalling the consolidation phase could pave the way for a major breakout, especially if volume begins to pick up on the upside.While SHIB’s price remains well below its 2025 highs, buyers are upbeat and are actively pulling tokens off exchanges.In one instance, token holders pulled more than 29 million SHIB from crypto exchanges in the past 24 hours. The data suggests active accumulation as a factor, and that means likely reduction in selling pressure.Historically, large outflows from major exchanges have pointed to smart money accumulation, a phase that often proceeds price explosion.This happens when rising demand follows a downtrend, which is what analysts are predicting will be the case as memecoins wake up.Shiba Inu price prediction: why SHIB tracks a potential breakoutAs noted, Shiba Inu’s technical outlook includes a falling wedge pattern on the daily chart.Shiba Inu Price ChartShiba Inu price chart by TradingViewThe token continues to trend lower, but is notably near the upper trend line amid signs of renewed buying interest.For bulls to confirm an upward breakout, the price would need to decisively clear resistance in the $0.0000085-$0.0000098 zone.Analysts say this should be on strong volume, with a surge above $0.00001 critical to near term continuation.Shiba Inu will benefit from positive vibes across the broader altcoin market, particularly if meme and utility tokens begin to gain traction.Bitcoin performance and investor appetite for high‑beta tokens like SHIB will also be critical.Developments across the Shiba ecosystem, Shibarium, and merchant adoption could all provide additional tailwinds.The post Shiba Inu price eyes breakout amid tightening wedge pattern appeared first on CoinJournal.
via CoinJournal: Latest Crypto News, Altcoin News and Cryptocurrency Comparison https://coinjournal.net/news/shiba-inu-price-eyes-breakout-amid-tightening-wedge-pattern/
via CoinJournal: Latest Crypto News, Altcoin News and Cryptocurrency Comparison https://coinjournal.net/news/shiba-inu-price-eyes-breakout-amid-tightening-wedge-pattern/

Ethereum (ETH) holds near $3,000 as institutions accumulate despite mixed short-term sentiment.Strong staking, wallet growth, and ETF inflows support Ethereum’s price floor.ERC-8004 could unlock AI-driven on-chain demand and long-term ETH value.Ethereum is entering a pivotal phase as price action, institutional flows, and protocol-level innovation begin to converge.After a volatile start to the year, ETH has reclaimed the $3,000 level, signalling renewed confidence among both traders and long-term holders.At the time of writing, Ethereum is trading near $3,010, with a market capitalisation of roughly $364 billion and a 24-hour trading range between $2,899 and $3,028.This recovery comes despite ETH still trading nearly 40% below its August 2025 all-time high near $4,946.The broader context suggests that Ethereum’s current consolidation may be less about weakness and more about preparation.Market structure shows resilience despite mixed sentimentEthereum’s recent dip below $3,000 was short-lived, as buyers stepped in aggressively to defend the psychological support level.On-chain data indicates that ETH is trading within a dense cost-basis cluster, which often reflects accumulation rather than distribution.The number of non-empty Ethereum wallets has reached a record high, highlighting continued network adoption even during periods of price uncertainty.Staking demand remains robust, with validator entry queues expanding while withdrawal activity stays relatively muted.This imbalance suggests that more participants are committing ETH to secure the network than looking to exit positions.Institutional behaviour further reinforces this trend, as reports indicate that companies and funds have added over one million ETH to their balance sheets in recent months.Spot Ethereum ETFs have also returned to net inflows after several days of outflows, led primarily by strong demand for Fidelity’s ETH product.However, selling pressure from US investors remains visible, as the Coinbase Premium Index continues to signal cautious domestic sentiment.Ethereum Coinbase Premium IndexEthereum Coinbase Premium Index | Source: CryptoQuantThis divergence between institutional inflows and retail hesitation has kept ETH locked in a tight range rather than triggering an immediate breakout.From a technical perspective, Ethereum faces near-term resistance around the $3,050–$3,100 zone, aligned with the 20-day exponential moving average.A decisive close above this region could open the door to a move toward $3,260, while a loss of $2,880 support would shift focus to lower demand zones near $2,775.Ethereum price analysisEthereum price chart | Source: TradingViewBullish long-term narratives remain intactDespite short-term consolidation, many traders argue that Ethereum’s broader market structure still supports significantly higher valuations.Several analysts point to historical cycle patterns and Wyckoff-style accumulation models that continue to project upside scenarios.In these frameworks, ETH’s current range is viewed as a re-accumulation phase rather than a topping formation.Some traders, like Annie and Bitcoinsensus, maintain that a sustained breakout could eventually place $10,000 ETH back on the table later in the cycle.This outlook is reinforced by steady growth in daily transactions, active addresses, and smart contract deployments across the network.Notably, Ethereum has achieved this activity growth while transaction fees have declined to multi-year lows, improving usability without sacrificing demand.Lower fees are often interpreted as a catalyst for long-term adoption, particularly for applications that rely on high transaction throughput.These structural improvements strengthen the long-term Ethereum price forecast as 2026 unfolds.ERC-8004 rollout adds a new fundamental catalystAgainst this backdrop, Ethereum is preparing for the mainnet rollout of ERC-8004, a new standard designed to support decentralised AI agents.ERC-8004 is going live on mainnet soon.By enabling discovery and portable reputation…
CoinJournal
10 Best Ethereum Wallets in 2026 | CoinJournal
Wondering what's the best Ethereum Wallets? Check out our comprehensive guide to find out which is the most suitable for you.
Bittensor (TAO) price gained 5% to intraday highs of $241.TAO rose as AI tokens rallied, with Render and Virtuals Protocol also up.Bulls target a breakout, with $240 as support amid potential macroeconomic tailwinds.Bittensor’s TAO token was showing strong bullish momentum as the artificial intelligence-linked cryptocurrency segment recorded notable gains.TAO ranked among the top performers over the past 24 hours, with traders eyeing a potential breakout above the $240 level.Beyond the broader AI narrative, improving market sentiment ahead of key macroeconomic events and earnings releases has helped drive renewed interest in the decentralised AI token.Bittensor price touches $240Bitcoin’s move to above $90,000 on Wednesday, and Ethereum’s uptick to $3,000 headlined crypto stories in early trading sessions on January 28.An anticipated Federal Reserve decision and Big Tech earnings, which highlight this week’s events, helped put risk assets back into an upward trajectory.As the top coins heave at resistance levels, Bittensor and other AI tokens rallied.TAO price jumped 5% as derivatives signalled retail interest, with trading volumes spiking alongside heightened open interest in futures markets.Having retested the $240 level and briefly touched $241, bulls are likely to regroup and power to new intraday highs.Macroeconomic tailwinds could catapult TAO higher.TAO gains as AI tokens rallyBittensor was not the only AI-linked token to post gains on the day.Rallies in Render, Virtuals Protocol and the Artificial Superintelligence Alliance placed all three among the top gainers within the top 100 cryptocurrencies by market capitalisation.RENDER, VIRTUAL, and FET rose between 5% and 9% over the past 24 hours, while smaller tokens such as Oasis, AI Companion and Kite recorded sharper advances.The broad-based move higher points to a renewed upswing in the AI crypto segment, underscoring the strength of the sector’s narrative, with Bittensor continuing to stand out through its subnet-based ecosystem.Improving sentiment across the category suggests potential accumulation, with large holders showing interest as asset managers roll out investment products that provide exposure to AI-focused digital assets.Bittensor price forecastBittensor’s architecture incentivises AI model contributions via competitive subnets, which is driving adoption and value accrual.Technical patterns signal a potential bullish breakout, with support targets above $240 likely if bulls dominate on strong volume.Bittensor TAO Price ChartTAO price chart by TradingViewOn the 4-hour chart, Bittensor sports positive momentum indicators, including RSI recovery and MACD.The latter paints a bullish crossover pattern, suggesting taking out bears above $240 might be pivotal for buyers.On the flip side, support lies around the $235-$230 area. Bulls will be eyeing the artificial intelligence narrative and the Fed.The post TAO price gains 5% as AI crypto segment posts broad rally appeared first on CoinJournal.
via CoinJournal: Latest Crypto News, Altcoin News and Cryptocurrency Comparison https://coinjournal.net/news/tao-price-gains-5-as-ai-crypto-segment-posts-broad-rally/
via CoinJournal: Latest Crypto News, Altcoin News and Cryptocurrency Comparison https://coinjournal.net/news/tao-price-gains-5-as-ai-crypto-segment-posts-broad-rally/

WisdomTree’s tokenised funds strengthen Solana’s institutional adoption narrative.SOL faces key resistance at $130 after forming support near $117.Rising on-chain activity boosts usage despite ongoing meme coin risks.SOL is currently trading around the mid-$120 range, having recently struggled to reclaim the psychologically important $130 level.Despite short-term weakness, broader developments within the Solana ecosystem suggest growing structural support beneath the price.At the centre of this renewed narrative is WisdomTree’s decision to expand its tokenised fund offerings onto the Solana blockchain.BREAKING: WisdomTree expands tokenized fund access to SolanaEnabling retail and institutional users to transfer, and hold @WisdomTreePrime’s full suite of regulated tokenized funds on Solana pic.twitter.com/HXxtSbKjns— Solana (@solana) January 28, 2026This move places Solana firmly within the accelerating real-world asset tokenisation trend led by traditional financial institutions.WisdomTree’s expansion of its tokenised funds to SolanaWisdomTree manages more than $150 billion in assets, making its presence on Solana a significant validation signal.By enabling tokenised money market, equity, fixed income, and allocation funds on Solana, WisdomTree is deepening institutional use cases for the network.The integration allows both institutional and retail participants to mint, trade, and hold regulated tokenised funds natively on-chain.Solana’s fast settlement speeds and low transaction costs appear to be key reasons behind WisdomTree’s expansion choice.This development strengthens Solana’s positioning as a blockchain capable of supporting regulated financial products at scale.Institutional adoption often acts as a slow-burning catalyst rather than an immediate price trigger.However, it can materially alter long-term demand dynamics for SOL as the network utility expands.Technical structure and speculative activity shape short-term outlookAt the same time, market participants are watching SOL’s technical structure closely.Recent price action has shown signs of a potential double-bottom formation around the $117 area.This pattern is often interpreted as a stabilisation phase following extended downside pressure.If SOL can maintain support above this region, technical traders see room for a move toward higher resistance zones.The $130 level represents a critical short-term barrier that has capped upside momentum.A clean break above $130 could shift market sentiment decisively toward a bullish continuation.Beyond technicals, on-chain activity across Solana continues to show mixed but notable signals.Meme token activity on Solana has experienced a surprising revival after months of reduced engagement.Platforms like Pump.fun have driven a surge in new token creation, approaching an eleven-month high.Hundreds of thousands of addresses have re-engaged with Solana’s meme economy in recent weeks.This activity has translated into rising decentralised exchange volumes and fee generation.While much of this participation is short-term and speculative, it still contributes to network usage.Higher transaction counts and fee flows indirectly reinforce SOL’s role as the network’s economic backbone.However, the meme token sector has also highlighted ongoing risks within Solana’s ecosystem.The rapid collapse of the LICK memecoin underscored persistent issues around insider concentration and token launch practices.Events like this can weigh on sentiment, particularly among more risk-averse investors.Nevertheless, speculative excess has historically coexisted with meaningful innovation during growth phases.The post Can SOL break past $130 as WisdomTree expands tokenised funds to Solana? appeared first on CoinJournal.
via CoinJournal: Latest Crypto News, Altcoin News and Cryptocurrency Comparison https://coinjournal.net/news/can-sol-break-past-130-as-wisdomtree-expands-tokenised-funds-to-solana/
via CoinJournal: Latest Crypto News, Altcoin News and Cryptocurrency Comparison https://coinjournal.net/news/can-sol-break-past-130-as-wisdomtree-expands-tokenised-funds-to-solana/
X (formerly Twitter)
WisdomTree Prime® (@WisdomTreePrime) on X
Save, Spend, & Invest digital assets like Bitcoin, Ether, Digital Gold & more!
Important Disclosure: https://t.co/bSWUks175x
Download the App Now! 👇
Important Disclosure: https://t.co/bSWUks175x
Download the App Now! 👇
Jupiter price jumped to above $0.23 as several altcoins pumped.Social chatter around airdrop activity and exchange integrations.JUP is also up for robust product adoption on Solana.Jupiter (JUP), the cryptocurrency token of Solana’s leading decentralized exchange, rose to highs of $0.23 on Wednesday, tracking intraday momentum across the broader market.The double-digit gains, which extend Jupiter’s uptick amid multiple key catalysts, mean another surge could bring the $0.30 level into view.Why is JUP price rallying this week?JUP is climbing alongside broader altcoin gains, with the token extending its rally to 13% over the past week.Bulls edged nearly 10% up in the past 24 hours, before a slowdown cut these to around 8% at the time of writing.After touching highs near $0.23, JUP traded around $0.21, but its latest rally reflects trader interest in Solana’s leading DEX aggregator.One key tailwind is the final Jupuary snapshot scheduled for January 30.Demand is spiking as users position for the potential 200 million JUP rewards. This event has amplified trading activity and liquidity provision ahead of the deadline.Meanwhile, Coinbase’s recent Solana integration further bolsters momentum. By enabling users to trade via Jupiter directly within the exchange, Coinbase puts the DEX on track for expansion to millions of retail traders.Elsewhere, Jupiter has established its footprint with product developments like JupUSD stablecoin and Jupiter Lend, with DeFiLlama metrics showing a sharp increase in revenue generated.Notably, Meteora, Jupiter and Uniswap saw huge revenues in 2025. Per data, the three platforms dominated other DeFi protocols’ fee revenue, with each generating well over $1 billion over the year.DEX volume has also increased significantly over the past week.Jupiter price prediction: Is $0.30 next?JUP’s price outlook is bullish amid the latest gain.While the long-term trend highlights the plunge from above $1 in 2025, resilience in the past weeks has technical indicators pointing to a possible momentum shift.The Moving Average Convergence Divergence (MACD) boasts a bullish crossover, while histogram bars have turned positive.Also alluding to renewed buying strength is the Relative Strength Index (RSI), which hovers near 58 on the daily chart.Except for a looming unlock of about 53 million JUP tokens, the overall picture is primarily positive.If transaction flows and user engagement hold firm, a breakout to $0.30 will highlight $0.60 as the next target.However, this confluence of catalysts could be overridden by broader market headwinds. JUP support lies in the $0.20-$0.18 area.Jupiter price reached its all-time high of $2.04 in January last year.The post Jupiter price prediction: JUP extends gains as bulls eye $0.30 next appeared first on CoinJournal.
via CoinJournal: Latest Crypto News, Altcoin News and Cryptocurrency Comparison https://coinjournal.net/news/jupiter-price-prediction-jup-extends-gains-as-bulls-eye-0-30-next/
via CoinJournal: Latest Crypto News, Altcoin News and Cryptocurrency Comparison https://coinjournal.net/news/jupiter-price-prediction-jup-extends-gains-as-bulls-eye-0-30-next/
CoinJournal
Jupiter price prediction: JUP extends gains as bulls eye $0.30 next
Jupiter price has retested the $0.23 resistance level amid key catalysts, and JUP bulls could eye $0.30 next
Grayscale has filed for an Sui ETF, boosting institutional interest in SUI.SUI currently trades at $1.41, facing key resistance at $1.55.Analysts warn of a possible short-term dip before a stable base forms.SUI, the native token of the Sui blockchain, is experiencing renewed optimism following Grayscale’s update to its S-1 form for a Sui-focused ETF.The proposed ETF would trade under the ticker GSUI on the NYSE Arca, and it is designed to include staking features, allowing investors to earn yield while holding the token.Coinbase will serve as the prime broker for the ETF, while the Bank of New York Mellon will provide administrative support.Other firms, including Bitwise and Canary Capital, have also filed for SUI-related products.These signals are growing institutional interest in the Sui ecosystem.The filings suggest that SUI may gain traction not only among retail investors but also professional investors seeking regulated exposure.Sui price analysisSUI is currently trading at $1.41, down 3.6% over the past seven days.Its 24-hour trading range has been narrow, between $1.40 and $1.45.Technical analysts point to $1.55 as the next key resistance level that traders should watch.A break above this point could pave the way for further gains toward $1.60 and $1.68.However, short-term support is currently around $1.40, and a decisive break below this could push SUI toward the $1.20–$1.30 range.The Relative Strength Index (RSI) suggests SUI may be oversold in the short term, providing potential for a rebound.Sui price analysisSui price chart | Source: TradingViewDespite this, some analysts caution that the recent bounce may be weak compared to larger cryptocurrencies like Bitcoin and Ethereum.They suggest that SUI could retest lower support levels near $1 or slightly above, before forming a more stable base.The 7-day range of $1.38 to $1.54 indicates volatility but also shows that buyers are still defending critical price zones.SUI price outlookInstitutional interest is growing as the broader crypto market navigates volatility.ETF filings from multiple firms demonstrate confidence in the long-term prospects of SUI.At the same time, historical performance shows that the altcoin has faced large swings, with an all-time high of $5.35 and a low of $0.3648.Even with these fluctuations, the token has gained more than 285% from its recent low, reflecting strong recovery potential.Trading volume remains healthy, with over $635 million exchanged in the last 24 hours.This liquidity can support price movements as the market reacts to ETF developments and technical patterns.If bullish momentum persists, the cryptocurrency may challenge the $1.55 resistance in the near term.Conversely, failure to break above key levels could result in a consolidation phase or minor pullback.The combination of institutional interest, ETF filings, and technical setups makes this a critical moment for SUI.Investors and traders will likely monitor both price action and regulatory updates closely.As the token navigates resistance and support levels, the next few weeks could determine its trajectory.With proper momentum, SUI could be poised for a renewed bullish phase, edging closer to $1.55.The post SUI price outlook: Grayscale Sui ETF filing lifts sentiment as token eyes $1.55 resistance appeared first on CoinJournal.
via CoinJournal: Latest Crypto News, Altcoin News and Cryptocurrency Comparison https://coinjournal.net/news/sui-price-outlook-grayscale-sui-etf-filing-lifts-sentiment-as-token-eyes-1-55-resistance/
via CoinJournal: Latest Crypto News, Altcoin News and Cryptocurrency Comparison https://coinjournal.net/news/sui-price-outlook-grayscale-sui-etf-filing-lifts-sentiment-as-token-eyes-1-55-resistance/
CoinJournal
Bitwise files for spot SUI ETF as competition intensifies in crypto fund market
Bitwise files for a spot SUI ETF in the US, adding pressure to the crypto ETF race and signalling rising momentum for altcoin-based funds.
Chiliz (CHZ) price fell sharply on Thursday, with a more than 15% plunge sending prices to lows of $0.046.Losses for the token comes as Bitcoin price drops sharply to impact top altcoins.Upbeat sentiment around CHZ remains amid roadmap plans and World Cup 2026 anticipation.The CHZ token, native to the leading blockchain platform powering fan engagement in sports, saw its value tumble as the broader altcoin market faced a fresh downturn.Chiliz traded to its intraday lows as Bitcoin dropped to under $85,000 again.BTC’s sharp plunge has altcoins in peril mode, with Ethereum down to $2,800, XRP to $1.79, and Solana to $117. CHZ ranked as one of the biggest losers in the top 100 by market cap.CHZ dips after recent surgeThe Chiliz price enjoyed a robust 30% weekly rally leading into late January, with a sudden pump outpacing a slumping global crypto market. CHZ pumped to near $0.06.In reality, the upswing can be traced back to the momentum of mid-December 2025, when bulls shattered the $0.035 resistance level.The uptick coincided with heightened anticipation for the FIFA World Cup 2026 set for the summer in the United States, Mexico, and Canada.Chiliz’s Fan Token ecosystem, which powers tokens for clubs like FC Barcelona and Juventus, has positioned itself as a key blockchain partner.Event-driven sentiment and Chiliz Chain 2.0 upgrades bolstered bulls. However, concerns over fan attendance amid US visa bans and boycott calls have slightly dampened the outlook.Chiliz Price ChartChiliz price chart by CoinMarketCapSharp declines come amid this, with widespread profit-taking by short-term holders and mounting weakness across altcoins, exacerbating the situation.Chiliz price forecast: any bullish catalysts?The current market conditions could allow bears to target the $0.040-$0.035 support zone.However, beyond its recent volatility, Chiliz’s price may ride broader tailwinds.The FIFA World Cup in June-July 2026 looms as a centerpiece, while upgrades and regulatory developments could ignite further Fan Token launches.Chiliz’s “2030 Vision” roadmap, which emphasizes DeFi integrations and institutional tie-ups, also adds to the potential bullish catalysts.The optimism for Chiliz also lies around the implementation of a transaction fee burning model similar to Ethereum’s EIP-1559.With this mechanism, a portion of CHZ is burned every time users trade Fan Tokens, mint real-world assets, or transfer a media rights asset.Users pay gas fees using the CHZ token, and a reduction in supply can significantly impact prices in the long term.Technically, a rebound above the $0.050 psychological level will hint at resilience. A break above $0.064, the token’s January 17 peak, could bring $0.10 into view.The MACD’s upward histogram and OBV strength suggest accumulation may persist.The post Chiliz price drops 15% amid sharp altcoin pullback appeared first on CoinJournal.
via CoinJournal: Latest Crypto News, Altcoin News and Cryptocurrency Comparison https://coinjournal.net/news/chiliz-price-drops-15-amid-sharp-altcoin-pullback/
via CoinJournal: Latest Crypto News, Altcoin News and Cryptocurrency Comparison https://coinjournal.net/news/chiliz-price-drops-15-amid-sharp-altcoin-pullback/
CoinJournal
Chiliz price forecast: CHZ extends rally as bulls eye the $0.06 level
CHZ is trading above $0.053 and could rally higher in the near term as Chiliz intensifies adoption ahead of the 2026 World Cup.
Optimism (OP) underperformed as risk-off sentiment hit high-beta altcoins hardest.The buyback plan is delayed, small, and lacks immediate supply reduction.Technical breakdown below key averages has triggered strong sell-side momentum.The Optimism (OP) token is falling even after token holders approved a long-awaited buyback plan.At first glance, this seems counterintuitive, since buybacks are often seen as bullish for token prices.However, the market reaction highlights the gap between long-term fundamentals and short-term trading reality.OP is currently trading around $0.27, down roughly 8.8% in the past 24 hours.This decline is sharper than the broader crypto market’s 5.26% drop over the same period.The underperformance signals that OP is facing pressures beyond simple market noise.Market-wide risk aversion is dragging down high-beta tokensThe crypto market is currently in a clear risk-off phase.Investors are rotating away from speculative assets and toward traditional safe havens.Gold has surged to record highs, reflecting heightened global uncertainty.At the same time, Bitcoin has slid to around $85,000.When Bitcoin weakens during risk-off periods, altcoins typically fall harder.OP is considered a high-beta asset, meaning it magnifies broader market moves.As a result, even modest market stress translates into outsized losses for OP.The Fear and Greed Index sits at 38, firmly in “Fear” territory.This indicates traders are prioritising capital preservation over growth opportunities.In such conditions, narratives like governance wins and future buybacks struggle to gain traction.Instead, liquidity dries up and sellers dominate price action.This macro backdrop sets the stage for OP’s underperformance.The buyback approval didn’t meet short-term market expectationsWhile Optimism token holders have approved a proposal to allocate 50% of Superchain sequencer revenue to OP buybacks, the market has reacted negatively rather than positively, and the main reason is timing.The buybacks are scheduled to begin in February, not immediately. For short-term traders, delayed execution reduces the perceived impact.The scale of the program also disappointed investors. Annual buybacks are estimated at around $8 million.That figure represents roughly 1.5% of OP’s current market capitalisation.Such a modest allocation is unlikely to offset sustained selling pressure. Additionally, the plan does not include token burns.Repurchased tokens are sent to the treasury, leaving future supply decisions uncertain.At the same time, token unlocks continue to add supply to the market. This imbalance weakens the buyback narrative in the near term.Rather than acting as a price floor, the announcement became a “sell the news” event.Conclusion: long-term promise, short-term pressureOP’s price decline reflects a convergence of macro, narrative, and technical factors.Market-wide risk aversion has reduced demand for speculative altcoins.The buyback plan, while structurally positive, lacks immediate impact.The token recently broke below its 7-day and 30-day simple moving averages, triggering algorithmic and momentum-based selling.Optimism (OP) priceOptimism (OP) price chart | Source: TradingViewThe Moving Average Convergence Divergence (MACD) indicator has also turned negative, pointing to accelerating downside momentum.The Relative Strength Index (RSI) remains near 44, suggesting OP is not yet oversold, meaning there is little technical support from bargain hunters.Together, these forces explain why OP is falling despite positive governance news.Long-term, tying token value to Superchain revenue remains a meaningful shift.Short-term, however, traders are focused on survival rather than future alignment.The next major test, according to analysts, will be whether OP can hold the $0.2528 support level.Upcoming macro data, particularly US inflation metrics, may determine the next move.But until the market sentiment improves, OP is likely to remain under pressure despite its improving fundamentals.The post Here’s why…
CoinJournal
Chiliz price drops 15% amid sharp altcoin pullback
Chiliz (CHZ) plunges 15% as Bitcoin drags altcoins lower, but World Cup 2026 hype and roadmap upgrades keep bulls hopeful.
Bitcoin fell below $85,000 and touched a low of $84,250.CoinGlass data shows total liquidations hit $804 million over the past 24 hours.The crash happened as gold fell from its peak above $5,500 on Thursday.Cryptocurrency markets saw a sharp risk-off move on Thursday, with Bitcoin sliding to a low of $84,250.The sell-off swept through major tokens, sending shockwaves across the crypto derivatives market.Long positions bore the brunt of the move, as the drop pushed total liquidations over the past 24 hours above $800 million.The downturn coincided with an abrupt reversal in gold prices, with the metal retreating from recent highs above $5,500.Analysts cited mounting macroeconomic and geopolitical tensions as key drivers of the sudden shift in sentiment.Bitcoin Price ChartBitcoin price chart by CoinMarketCapBitcoin tanks as gold sheds gainsBitcoin has struggled to reclaim the $90,000 support level, with a brief move toward that mark fading as gold surged.During Asian and early European trading on January 29, the cryptocurrency began a steady decline, slipping below $88,000.Selling accelerated as the US session opened, with Bitcoin sliding on above-average trading volumes.The sell-off pushed the benchmark asset to an intraday low near $84,000, its weakest level since December 2025.The same area had seen a bearish retest in November, a move that may have prompted at least one large holder to sell roughly 200 BTC.Over the past 24 hours, Bitcoin was down about 5%.The broader market sell-off dragged Ethereum to around $2,800, XRP to $1.79, and Solana below $120.Crypto investor Ted wrote on X that the latest drop has left Bitcoin trading near a critical technical level.$BTC is now back into its strong support zone.Nearly $140,000,000 in spot bids have been placed between the $80,000-$84,000 level.If this zone is lost, Bitcoin will go straight to April 2025 lows. pic.twitter.com/QBbW294Rc0— Ted (@TedPillows) January 29, 2026The Bitcoin sell-off unfolded amid a broader shift to risk aversion across global markets.Equities moved lower, led by a sharp decline in Microsoft shares, while investors also reacted to a sudden reversal in precious metals.Gold, which had climbed to a record high above $5,500 an ounce earlier on Thursday, reversed course and fell toward $5,300. Silver also retreated sharply from recent highs.Analysts said the move reflects a mix of macroeconomic pressures and heightened geopolitical risks, including rising tensions between the United States and Iran.The Federal Reserve’s decision to hold interest rates on Wednesday, alongside guidance suggesting rate cuts may be delayed until late 2026, further weighed on risk assets, prompting investors to favour short-term cash positions over digital assets or traditional safe havens.Over $800 million was wiped out amid a surge in derivatives liquidationsBitcoin’s sharp decline was mirrored in the derivatives market, where leveraged positions were unwound aggressively.Data from crypto analytics platform Coinglass show that more than $800 million in positions across spot and futures markets were liquidated over the past 24 hours, with the bulk of losses borne by long traders.Bitcoin alone accounted for $332 million in liquidations during the period, of which more than $318 million were long positions, according to the data.While the scale of the sell-off and liquidations was smaller than the market dislocation seen on October 10, 2025, analysts say the episode underscores ongoing fragility in market positioning.The post Bitcoin crashes to $84K, triggering $800M in crypto liquidations appeared first on CoinJournal.
via CoinJournal: Latest Crypto News, Altcoin News and Cryptocurrency Comparison https://coinjournal.net/news/bitcoin-crashes-to-84k-triggering-800m-in-crypto-liquidations/
via CoinJournal: Latest Crypto News, Altcoin News and Cryptocurrency Comparison https://coinjournal.net/news/bitcoin-crashes-to-84k-triggering-800m-in-crypto-liquidations/

Mevstake 2.0 replaces pooled MEV operations with dedicated personal bots per user.Individual bot architecture improves load distribution and system stability.Fully automated MEV execution with no strategy setup or manual oversight.Mevolaxy has announced the next stage of development for its Mevstake direction – Mevstake 2.0. The key change in the new version lies in the product architecture: a format of personal MEV bots is being implemented instead of a shared operational model.In Mevstake 2.0, each participant receives a dedicated MEV bot that operates within the platform’s set parameters. This means that operations are no longer pooled together but are processed individually at the infrastructure level.According to the team, this approach allows for:More precise distribution of load,Isolation of processes between users,Simplified system stability control.From the user’s perspective, the interaction format remains largely unchanged. The MEV bots operate fully automatically – requiring no manual configuration, strategy management, or constant monitoring.The user does not interact directly with the logic of MEV operations. The result is generated at the system level.Mevstake 2.0 will be available in limited capacity. Mevolaxy explains this by stating that the personal model requires dedicated computational resources for each participant. This approach simplifies scaling and reduces technical risks at the early stage.Mevolaxy describes the launch of Mevstake 2.0 not as a new product, but as an evolution of the existing solution. The primary focus is not on changing the terms, but on the internal structure and operating principles of the system.The post Mevstake 2.0: transition to personal MEV bots in Mevolaxy appeared first on CoinJournal.
via CoinJournal: Latest Crypto News, Altcoin News and Cryptocurrency Comparison https://coinjournal.net/news/mevstake-2-0-transition-to-personal-mev-bots-in-mevolaxy/
via CoinJournal: Latest Crypto News, Altcoin News and Cryptocurrency Comparison https://coinjournal.net/news/mevstake-2-0-transition-to-personal-mev-bots-in-mevolaxy/
Smart Energy Pays enters the US market, targeting scalable digital payments and settlement infrastructure.The launch includes listing the SEP utility token on UZX to support liquidity and ecosystem access.Built on Smart Energy Chain, the platform emphasizes compliance, security, and real-world payment use cases.Smart Energy Pays has announced its expansion into the United States, reinforcing its strategy to build a globally scalable financial infrastructure platform.The platform is operated by Smart Energy Pay Solution Ltd., positioning itself at the intersection of digital finance and real-world applications.North America represents a key market for digital financial infrastructure due to its advanced payments ecosystem and strong institutional demand. Industry forecasts suggest the US fintech market will exceed $330 billion by 2026.The company’s US launch is supported by the listing of the SEP utility token on UZX, a centralized digital asset exchange focused on global accessibility and liquidity. The listing supports efficient settlement and ecosystem access.Underlying the platform is the Smart Energy Chain, an independent Layer-1 blockchain built to process real-world events and transactions at scale. It forms the backbone for all operational processes within the ecosystem.Smart Energy Pays functions as a financial and settlement platform, enabling cross-border payment flows and access to digital financial services. The SEP token is used strictly for technical settlement, fees, and validation processes.Security and compliance measures include ISO 27001 certification, PCI-DSS and SOC-2 standards, KYC and AML procedures, and independent security audits conducted with Hacken.For further information, visit here: Smart Energy Official Website | X | How to Sign Up on Smart Energy PaysThe post Smart energy pays enters the US market, targeting scalable financial infrastructure appeared first on CoinJournal.
via CoinJournal: Latest Crypto News, Altcoin News and Cryptocurrency Comparison https://coinjournal.net/news/smart-energy-pays-enters-the-us-market-targeting-scalable-financial-infrastructure/
via CoinJournal: Latest Crypto News, Altcoin News and Cryptocurrency Comparison https://coinjournal.net/news/smart-energy-pays-enters-the-us-market-targeting-scalable-financial-infrastructure/
Smart Energy Pay
Smart Energy Pay - Bringing Energy to Blockchain | Smart Energy Pay is a blockchain-powered solution designed to revolutionize the energy sector by enabling secure, transparent energy payments. Integrating our patented 3D wind device for renewable energy…
Kevin Warsh nominated as Fed Chair, pending Senate confirmation.Known for hawkish policy yet supportive of cryptocurrencies.Markets and crypto reacted quickly to the nomination news.US President Donald Trump has officially nominated Kevin Warsh as the next Chair of the Federal Reserve.The announcement came through Trump’s social media platform, highlighting Warsh’s experience and expertise.Trump announces he has picked Kevin Warsh for Fed ChairDonald Trump announces his Fed Chair pick | Source Truth SocialWarsh, 55, is a former member of the Federal Reserve Board of Governors, having served from 2006 to 2011.He was on the Fed during the 2008 financial crisis, giving him significant insight into economic turbulence.Warsh also brings a strong academic and professional background, with a degree from Stanford University and a law degree from Harvard.Before joining the Fed, he worked as an investment banker at Morgan Stanley and served in the George W. Bush administration.Currently, he is a fellow at the Hoover Institution and a lecturer at Stanford Graduate School of Business.Trump’s nomination is not yet final, as Warsh must receive confirmation from the US Senate.The confirmation process is expected to be closely watched and potentially contentious.A hawkish yet crypto-friendly choiceWarsh is known for his hawkish stance on inflation and interest rates.He has criticised the Fed’s past policies of ultra-loose monetary stimulus and large asset purchases.However, Warsh is seen as more open to digital assets than current Fed Chair Jerome Powell.In a recent interview on Hoover Institution has suggested that Bitcoin (BTC) and other cryptocurrencies could act as a form of market discipline rather than a threat.This perspective has drawn attention from the crypto community, which is eager for more favourable regulatory approaches.Analysts note that Warsh’s approach could influence both traditional markets and the cryptocurrency sector.Investors are already adjusting expectations for the dollar, equities, and digital assets.Bitcoin, in particular, has experienced volatility as traders react to Warsh’s nomination.Warsh’s potential policies could emphasise balance-sheet reduction and controlled rate hikes.This combination of hawkish monetary policy and crypto openness is relatively unique for a Fed Chair.Market reactionMarkets reacted quickly to the nomination, with some risk assets experiencing a short-term pullback.Traders are pricing in the possibility of tighter monetary conditions under Warsh’s leadership.Prediction markets had already favoured Warsh before the official announcement.His nomination underscores the importance of Fed leadership for global markets, inflation, and economic stability.The Senate confirmation process will likely draw debate over Fed independence and Trump’s influence on monetary policy.Warsh’s blend of Wall Street experience, central bank knowledge, and crypto-friendly views makes him a notable pick.If confirmed, he would face the challenge of balancing inflation control with market expectations for digital assets.His tenure could set a new precedent for how the Fed interacts with cryptocurrencies.The post Trump taps crypto-friendly Kevin Warsh to lead the Federal Reserve appeared first on CoinJournal.
via CoinJournal: Latest Crypto News, Altcoin News and Cryptocurrency Comparison https://coinjournal.net/news/trump-taps-crypto-friendly-kevin-warsh-to-lead-the-federal-reserve/
via CoinJournal: Latest Crypto News, Altcoin News and Cryptocurrency Comparison https://coinjournal.net/news/trump-taps-crypto-friendly-kevin-warsh-to-lead-the-federal-reserve/

XRP slid to near $1.5 amid a broad crypto selloff and $2.5 billion in liquidations, before a modest rebound.Heavy liquidations, weak volumes, and bearish indicators keep XRP’s near-term technical outlook fragile.Ripple secured an EU EMI license in Luxembourg, boosting its regulatory footing despite XRP volatility.XRP slid sharply over the weekend as a broad risk-off move swept through cryptocurrency markets, triggering heavy liquidations and pushing the token to its lowest level since December 2025.The selloff came alongside steep declines in Bitcoin, Ethereum and even traditional safe havens such as gold and silver, underscoring the depth of the market rout.The turbulence unfolded even as Ripple, the payments firm closely associated with XRP, secured a key regulatory milestone in Europe after receiving final approval for an Electronic Money Institution license in Luxembourg, strengthening its ability to scale regulated payment services across the European Union.XRP slides to multi-month lows amid broad market selloffXRP is attempting to stabilise after a sharp weekend selloff that dragged its price down to around $1.5, as bearish pressure swept through cryptocurrency markets.After failing to sustain gains near $1.8, the token fell to its lowest level since December 2025.The decline came amid a broader market rout that saw Bitcoin slide below $75,000, and Ethereum drop toward $2,100, pulling most major altcoins lower.The risk-off move extended beyond crypto.Gold, which had recently climbed above $5,500 an ounce, fell to about $4,620, marking its steepest single-day decline in more than a decade, while silver also posted heavy losses.Over $2.5 billion liquidatedSelling pressure intensified as the US entered a partial government shutdown, while markets showed little reaction to President Donald Trump’s nomination of Kevin Warsh as the next Federal Reserve chair.Warsh is widely viewed as supportive of digital assets.In crypto markets, more than $2.5 billion in leveraged positions were liquidated on Jan. 31.According to Coinglass, this ranked as the 10th-largest liquidation event on record, though well below the $19 billion wipeout seen during the October 10, 2025 crash.On-chain data showed that more than $10 million in XRP positions were liquidated in the past 24 hours, with about $7.4 million of those in long positions.CoinGlass data indicated that more than 4,300 traders were affected, while daily volatility in XRP exceeded 7.5%.Some market participants blamed Binance for exacerbating the selloff, though the exchange and its former chief executive Changpeng Zhao rejected those claims.Technical outlook remains fragile despite modest reboundXRP’s market capitalisation has fallen to roughly $97 billion, reflecting a sharp contraction as investors moved away from risk assets.Daily trading volume declined 16% to around $5.4 billion, signalling weakening liquidity and limited buying interest.MediaFrom a technical perspective, the daily chart remains broadly bearish.While the relative strength index suggests a potential rebound from oversold levels, weak momentum could limit upside.The MACD continues to indicate strengthening bearish conditions, with the histogram widening.As of Monday, February 2, XRP was trading near $1.6, recovering modestly from its weekend lows.A sustained break below $1.5 could open the way toward the $1.24 support area.On the upside, a move back above $1.8 may help stabilise sentiment and allow for a potential retest of the $2.00 to $2.30 range.Ripple secures EU EMI license in LuxembourgRipple has received final approval from Luxembourg’s financial regulator for a full Electronic Money Institution license, converting a preliminary authorization granted in January.The license, issued by the Commission de Surveillance du Secteur Financier, enables Ripple to scale its blockchain-based payments and digital asset services across the European Union under a regulated framework.The approval builds on Ripple’s recent regulatory gains in the UK, where the Financial…
CoinJournal
Trump taps crypto-friendly Kevin Warsh to lead the Federal Reserve
Trump nominates Kevin Warsh as Fed Chair, a hawkish yet crypto-friendly pick, sparking market and cryptocurrency reactions.
Solana price fell to lows of $96 as cryptocurrencies crashed.Declines align with fresh outflows from digital asset investment products.SOL saw over $31 million in net outflows last week, the first in three weeks.Solana (SOL) fell below $100 for the first time since April 2025 as a sharp sell-off pushed Bitcoin under $75,000.As BTC dumped to its lowest level in nearly 10 months, Solana touched lows of $96.43.This happened as crypto markets experienced extreme volatility.Dips for all the top coins, including Ethereum and XRP, resulted in over $2.5 billion in liquidations in 24 hours.Per data from Coinglass, more than $4 billion in long positions have been liquidated across the crypto market over the past 4 days.Most of the bets wiped out were longs, with this coming amid Friday’s historic collapse in metals.Gold dumped from above $5,500 and silver plunged 39%, losses that cascaded across the crypto sector.The wipe-out is one of the largest liquidations in crypto, with the top of the ladder being the nearly $20 billion liquidated in October 2025.SOL sees $31.7 million in investment outflowsThe dramatic collapse in crypto prices coincided with a sharp surge in capital exit from digital asset investment products.According to asset manager CoinShares, the digital asset market recorded a second straight week of outflows, with over $1.7 billion exiting amid the panic selling.The outflows mean the sector has now reversed year-to-date inflows, pushing global year-to-date net flows to $1 billion.CoinShares head of research James Butterfill said the redemptions signal “a marked deterioration in investor sentiment towards the asset class.”“We believe this reflects a combination of factors, including the appointment of a more hawkish US Federal Reserve Chair, continued whale selling associated with the four-year cycle, and heightened geopolitical volatility,” Butterfill added.Notably, Solana saw over $31.7 million in net outflows last week, the altcoin’s first weekly outflow in three weeks.Solana price prediction: $100 remains the key levelBears have established dominance in the first weeks of 2026, continuing the trend witnessed in the last quarter of 2025.Macroeconomic conditions and geopolitical headwinds have contributed to this outlook, and analysts at QCP point to the ETF outflows and broader sentiment as likely negative catalysts for cryptocurrencies in the short term.SOL could nosedive under $100 amid this trend. A retest of the $96-$80 area will embolden bears further.Solana Price Chart Solana price chart by TradingViewHowever, a flip in sentiment portends a continuation above the psychological level.Solana price was above $102 at the time of writing, slightly up as other coins eye a rebound.If Bitcoin reclaims $82,000 and risk assets stabilise, SOL price could target the $120-$135 supply wall next.The post Solana price falls to 10-month low amid ETF outflows appeared first on CoinJournal.
via CoinJournal: Latest Crypto News, Altcoin News and Cryptocurrency Comparison https://coinjournal.net/news/solana-price-falls-to-10-month-low-amid-etf-outflows/
via CoinJournal: Latest Crypto News, Altcoin News and Cryptocurrency Comparison https://coinjournal.net/news/solana-price-falls-to-10-month-low-amid-etf-outflows/
CoinJournal
XRP slides to multi-month lows as liquidations surge amid market rout
XRP fell to lows of $1.50 over the weekend, with Bitcoin crashing under $75,000 and Ethereum to near $2,100
FinchTrade is a Swiss-based OTC liquidity provider, founded in 2021.Wert.io is a fintech company founded in 2020 that enables businesses to embed crypto purchasing.In the last 30 days alone, Wert processed $2.3 million in trading volume through FinchTrade.For digital platforms looking to onboard users into crypto, the challenge has always been the same: how to provide seamless fiat-to-crypto access without pushing customers to external exchanges.Wert set out to solve this problem by creating an embedded purchase widget that integrates directly into apps, wallets, and marketplaces, enabling retail users to buy small amounts of crypto instantly and compliantly.But building a smooth user experience requires more than just smart product design — it demands reliable liquidity, competitive pricing, and instant settlement.To achieve this, Wert partnered with FinchTrade, a Swiss-based OTC liquidity provider.Through FinchTrade’s non-custodial trading engine and aggregated liquidity pools, Wert can execute high-frequency transactions every second while keeping balances lean and risk exposure low.Founded by George Basiladze, Wert serves partners ranging from token sale projects to NFT marketplaces and Web3 wallets, helping them increase conversion, retain users, and unlock new revenue streams.Together with FinchTrade, Wert is scaling this model across Europe and preparing for new markets like Canada, while also expanding into crypto-to-fiat payout flows and GBP support.Solving liquidity and settlement challengesFor Wert, the biggest challenge in scaling its embedded widget was not only offering retail users a seamless front-end experience, but also managing liquidity and settlement efficiently behind the scenes.Handling thousands of small transactions each month meant finding a partner that could provide reliable execution, instant conversions, and competitive spreads — without forcing Wert to hold large balances or take on unnecessary risk.That’s where FinchTrade came in. Since 2022, Wert has leveraged FinchTrade’s non-custodial trading infrastructure and aggregated liquidity to deliver a frictionless back-end for its retail flows.Instant EUR settlement allows Wert to execute trades every few seconds while keeping reserves lean, ensuring end-users get their crypto on time, every time.“FinchTrade allows us to maintain smaller balances, benefit from instant settlement, and access deep liquidity in EUR pairs”, said George Basiladze, Founder & CEO of Wert. “The reliability of their trading infrastructure means we can focus on growing our product and partner network.” In the last 30 days alone, Wert processed $2.3 million in trading volume through FinchTrade — with the majority flowing through stablecoin pairs — proving the model’s efficiency and scalability.Driving results togetherThe collaboration between Wert and FinchTrade has already delivered tangible outcomes:Real-time execution: Retail users receive crypto instantly thanks to FinchTrade’s aggregated liquidity.Lower risk exposure: Instant EUR settlement eliminates the need for Wert to hold large reserves of BTC or fiat.High-frequency scalability: API-based integration supports Wert’s model of processing trades every few seconds.Product expansion: The partnership is evolving to cover new fiat pairs like GBP and reverse flows — enabling users to sell crypto and receive fiat payouts just as easily.Looking aheadWert is preparing for its next chapter: expanding into new markets like Canada, introducing collateralized lending products, and rolling out crypto-to-fiat solutions for its partners.Throughout this growth, FinchTrade will remain the liquidity backbone, ensuring flexibility, competitive pricing, and reliable settlement.“Wert represents the kind of forward-thinking partner we love to support,” said Nicola Boldrini, Growth Lead at FinchTrade. “By embedding our liquidity into their platform, they can scale confidently and deliver a seamless experience to retail users globally.” About FinchTradeFinchTrade is a Swiss-based OTC liquidity…
wert.io
Wert - Payment solutions for NFT and DeFi
Making purchasing of NFTs seamless and not requiring users to have crypto.
SUI slid below $1.10 amid a broad crypto selloff, tracking weakness in bitcoin and major altcoins.Hong Kong’s HashKey Exchange will list SUI/USD for professional investors from Feb. 4.A potential bullish reversal could see Sui price target $1.20-$1.34.HashKey Exchange, Hong Kong’s largest licensed cryptocurrency platform, is set to list Sui, a development that comes as the token struggles amid a sharp downturn across digital asset markets.Sui’s native token, SUI, has come under heavy selling pressure in recent sessions, sliding below $1.10 as the broader crypto market sold off aggressively.The decline coincided with Bitcoin trading around the $78,000 level, triggering losses across major and mid-cap tokens.SUI, now ranked outside the top 20 cryptocurrencies by market value, was trading around $1.13 as of Feb. 3, 2026.Why did SUI plummet?SUI’s pullback has largely tracked the wider risk-off move in crypto markets.The token is down about 12% over the past week, reflecting volatility seen across high-beta digital assets.Solana, for example, dropped to a 10-month low below $100 during the same period.The selloff has been driven by a combination of macroeconomic uncertainty and profit-taking following earlier rallies.These pressures persisted despite US President Donald Trump nominating crypto-friendly Kevin Warsh as his pick for the next Federal Reserve chair, a move that had initially been viewed as supportive for digital assets.However, with SUI hovering around $1.13 as of February 3, 2026, bulls are likely to get a major boost from news of a fresh listing on Hong Kong’s largest crypto platform HashKey Exchange.HashKey Exchange to add SUI/USD tradingSentiment around SUI may find near-term support from a new exchange listing.HashKey Exchange announced on Feb. 3 that it will list the SUI/USD trading pair.According to the exchange, over-the-counter trading in SUI/USD will open at 16:00 Hong Kong time on Feb. 4, 2026.Deposits and withdrawals for SUI are already live, allowing qualified participants to prepare ahead of trading.Access to the product will be limited to professional investors, in line with Hong Kong’s regulatory framework.📣 New Listing: SUI is coming to HashKey Exchange! @SuiNetwork✅ Deposits & Withdrawals: Open
✅ Trading Pair (Spot) : SUI/USD
✅ Listing Time: 16:00 (UTC +8), Feb 4👤 Available to: Professional Investors🎯 First 1000 to complete these tasks share 20 HKD! (1000*20)
✅… pic.twitter.com/cWF7ubxrks— HashKey Exchange (@HashKeyExchange) February 3, 2026HashKey Exchange operates under the city’s Virtual Asset Service Provider regime and has positioned itself as a compliant venue focused on security and institutional-grade access to digital assets.The listing is expected to improve regional liquidity for SUI, particularly as interest grows in high-throughput Layer-1 blockchains used in decentralised finance and Web3 applications.Sui price predictionHistorically, listings on major Asian exchanges have often led to spikes in trading activity for altcoins, driven by institutional and regional participation.While HashKey’s OTC focus narrows the immediate investor base, broader market stabilisation could amplify the impact of the listing.From a technical perspective, SUI appears oversold following the recent decline.The relative strength index has moved deep into oversold territory, suggesting the potential for a short-term rebound.A recovery would likely see $1.12 acting as a key support level.SUI Price ChartSui price chart by TradingViewNear-term resistance is seen in the $1.20 to $1.34 range, with the upper end marking a previous area of demand.However, momentum indicators such as the MACD remain bearish, pointing to ongoing downside risks.If buying interest fails to build, SUI could face renewed pressure below the $1.00 level.As with the broader crypto market, the token’s direction is likely to remain closely tied to shifts in risk sentiment and bitcoin price action in the days ahead. The post SUI slides amid crypto selloff as HashKey Exchange confirms new listing…
✅ Trading Pair (Spot) : SUI/USD
✅ Listing Time: 16:00 (UTC +8), Feb 4👤 Available to: Professional Investors🎯 First 1000 to complete these tasks share 20 HKD! (1000*20)
✅… pic.twitter.com/cWF7ubxrks— HashKey Exchange (@HashKeyExchange) February 3, 2026HashKey Exchange operates under the city’s Virtual Asset Service Provider regime and has positioned itself as a compliant venue focused on security and institutional-grade access to digital assets.The listing is expected to improve regional liquidity for SUI, particularly as interest grows in high-throughput Layer-1 blockchains used in decentralised finance and Web3 applications.Sui price predictionHistorically, listings on major Asian exchanges have often led to spikes in trading activity for altcoins, driven by institutional and regional participation.While HashKey’s OTC focus narrows the immediate investor base, broader market stabilisation could amplify the impact of the listing.From a technical perspective, SUI appears oversold following the recent decline.The relative strength index has moved deep into oversold territory, suggesting the potential for a short-term rebound.A recovery would likely see $1.12 acting as a key support level.SUI Price ChartSui price chart by TradingViewNear-term resistance is seen in the $1.20 to $1.34 range, with the upper end marking a previous area of demand.However, momentum indicators such as the MACD remain bearish, pointing to ongoing downside risks.If buying interest fails to build, SUI could face renewed pressure below the $1.00 level.As with the broader crypto market, the token’s direction is likely to remain closely tied to shifts in risk sentiment and bitcoin price action in the days ahead. The post SUI slides amid crypto selloff as HashKey Exchange confirms new listing…
CoinJournal
Solana price falls to 10-month low amid ETF outflows
Solana dropped to under $100 as Bitcoin dumped amid the latest market sell-off and as $31 million in bets were liquidated
Ripple’s XRP dropped nearly 5% in 24 hours and 20% in the past week.Bitcoin’s dip to $72,900 saw XRP come close to breaking below $1.50.XRP saw over $19 million in ETF inflows on February 3, 2026.XRP has fallen sharply, shedding about 20% over the past week to trade near the critical $1.50 level.The Ripple cryptocurrency, which has declined by about 5% over the past 24 hours amid a broader crypto market downturn, risks dipping below a key level despite witnessing a fresh uptick in exchange-traded fund inflows.Overall bearish pressure has led the cryptocurrency market cap to drop to $2.66 trillion, with the crash on “Black Sunday II” having plummeted Bitcoin to under $73,000 on Wednesday.Meanwhile, top altcoins such as Ethereum, BNB, and Solana have also sold off significantly.ETH, SOL and BNB dropped to $2,100, $91 and $727 respectively on Wednesday.Key triggers include President Trump’s tariff threats, panic sell-offs amid a risk asset dip, and negative reaction to Federal Reserve policy fears and the recent nomination of Kevin Warsh as the next Fed chair.Institutional ETF inflows have failed to stem the downside action.XRP price slips towards $1.50XRP’s slide to near $1.53 across major exchanges amid risk-off sentiment means that another slip could push prices lower.Data shows Ripple futures open interest currently averages $2.53 billion, and aligns with the shrinking retail demand and trader caution.Per CoinGlass data, OI has shrunk from over $8.3 billion on October 10, when a bloodbath pushed XRP price from above $2.80 to under $2.30.Sellers have since seen prices hit lows under $1.55, with the downside accelerating since January 6, 2026, when prices retested the $2.30 level.A dip in OI points to a sustained decline in retail interest, which has previously impacted bulls.The trend holds despite digital asset investment products, including spot XRP ETFs, seeing notable cumulative inflows over the past week.Spot XRP ETFs also attracted net inflows on Tuesday, with about $19.4 million in net inflows.What’s next for the Ripple (XRP) price?Bitcoin’s drop to $72.8,000 exacerbates the bearish outlook, despite the swift bounce as investors reacted to developments that prevented a US government shutdown. However, bears are still in control.XRP Price ChartXRP price chart by TradingViewXRP has lost over 33% in the past month, hitting $1.53 on February 4 and extending declines from January highs around $2.35.Analysts say $1.53-$1.50 is a potential key reload zone, but buyers must absorb the likely pressure.Bearish risks persist amid macro caution, and another leg down might potentially see sellers test lows of $1.25. However, the upside amid a bullish divergence has $1.59 as a key pivot towards $2.00.The post XRP price risks drop below $1.50 amid crypto market crash appeared first on CoinJournal.
via CoinJournal: Latest Crypto News, Altcoin News and Cryptocurrency Comparison https://coinjournal.net/news/xrp-price-risks-drop-below-1-50-amid-crypto-market-crash/
via CoinJournal: Latest Crypto News, Altcoin News and Cryptocurrency Comparison https://coinjournal.net/news/xrp-price-risks-drop-below-1-50-amid-crypto-market-crash/
CoinJournal
XRP slides to multi-month lows as liquidations surge amid market rout
XRP fell to lows of $1.50 over the weekend, with Bitcoin crashing under $75,000 and Ethereum to near $2,100
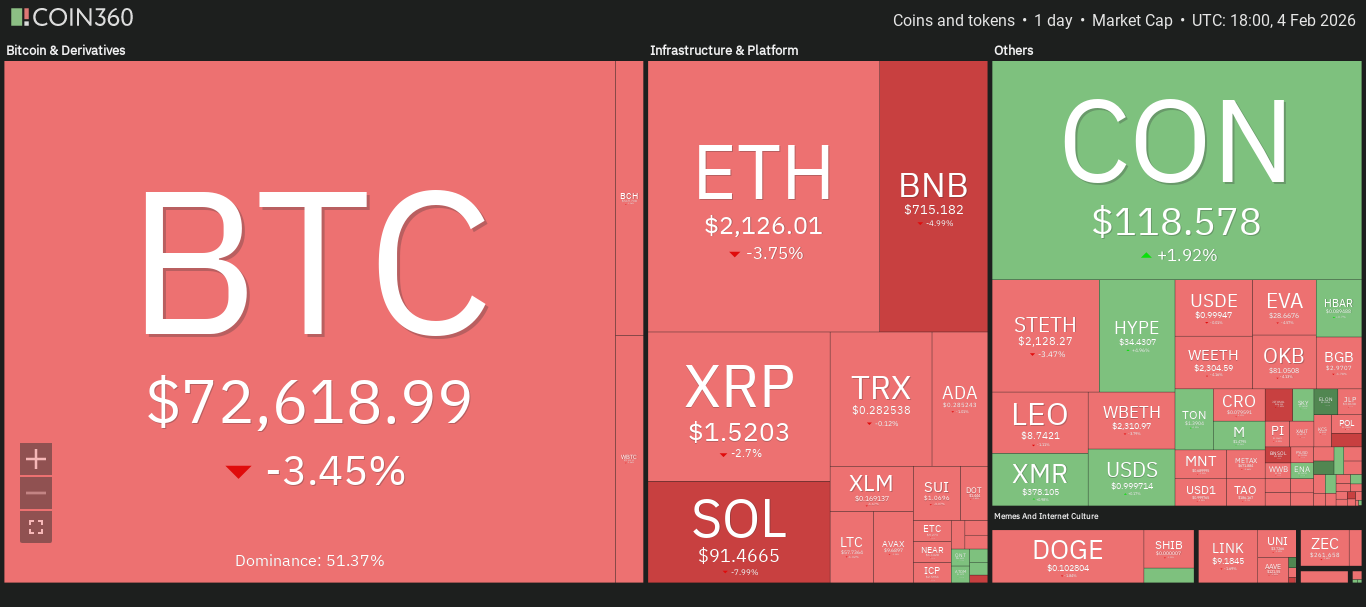
Solana dropped to $90 amid massive liquidations across the crypto market.Bitcoin and Ethereum fell to under $73,000 and $2,150.Standard Chartered forecasts SOL rally to $250 in 2026 and $2,000 by 2030.Cryptocurrencies are bearish, and Solana’s price has experienced one of the sharpest declines among top altcoins. In the past 24 hours, the cryptocurrency has dropped nearly 10% to under $91, with many traders caught off guard amid heightened market volatility.As can be seen in the crypto heat map below, Solana’s plunge aligns with broader market pressure. Billions of dollars in leveraged positions have been wiped out in the past week as the sector faces massive unwinding.Crypto Heat MapSolana among cryptocurrencies in red. Source: Coin360Price dips 10% amid crypto liquidationsWith market sentiment in shambles for much of 2026, it is no surprise that Bitcoin tanked to its multi-month lows of $72,800. BTC and ETH’s latest dips mean Michael Saylor’s Strategy and Tom Lee’s BitMine currently sit on billions of dollars in unrealized losses. Digital asset treasury companies that flocked to Solana, BNB, Cardano, and others have similar trajectories.For Solana, the coin’s price under the psychological level of $100 has strengthened this. Sellers sustained this negative trend with another 10% push over the past 24 hours, hitting lows of $90.60.Onchain perpetual markets on Solana contributed significantly, with over $70 million in liquidations from Solana-based platforms in the past 24 hours. During the downturn, over $65 million of these were longs. The surge in forced selling exacerbated the decline, with high leverage amplifying losses for over 15,900 bullish traders.The liquidations reflect the rapid deleveraging that has also wiped billions of bullish bets from Bitcoin and Ethereum.Solana price predictionThe SOL dip is part of a broader market correction, but there’s a potential for recovery if bulls hold $90.However, liquidity contractions and liquidation overhangs, such as the $800 million in total liquidations in the past 24 hours, suggest a possible down leg as excess leverage clears. The technical picture also has Solana trading below its 50-day moving average around $132, which adds to the bearish outlook of the RSI and MACD.Solana Price ChartSolana price chart by TradingViewSOL could drop to $70 if markets continue to struggle.Despite the overall bearish picture, Standard Chartered has pointed out a bullish forecast for SOL.According to the bank, SOL could reach $2,000 by 2030 but has cut its 2026 forecast to from about $310 to $250. Catalysts include the macro picture and capital flows, as well as a fresh explosion in rotation from memecoins to top altcoins. Stablecoin adoption is another factor in the bank’s outlook.The post Solana price outlook: bears test $90 amid massive liquidations appeared first on CoinJournal.
via CoinJournal: Latest Crypto News, Altcoin News and Cryptocurrency Comparison https://coinjournal.net/news/solana-price-outlook-bears-test-90-amid-massive-liquidations/
via CoinJournal: Latest Crypto News, Altcoin News and Cryptocurrency Comparison https://coinjournal.net/news/solana-price-outlook-bears-test-90-amid-massive-liquidations/
Bitcoin temporarily fell below $70,000, erasing gains built over the past 15 months.Over $840 million in leveraged long positions were liquidated during the sell-off.Traders now watch $65,000 support and $72,000 resistance for direction.Bitcoin has suffered one of its sharpest corrections in recent years, wiping out roughly 15 months of bull market gains in a swift and brutal sell-off.The world’s largest cryptocurrency temporarily plunged below the psychologically important $70,000 level, shocking traders who had grown accustomed to sustained upside momentum.The move did not happen in isolation, as it was accompanied by heavy liquidations, weakening sentiment, and visible stress across centralised exchanges.What initially appeared to be a routine pullback quickly evolved into a deeper reset for the broader crypto market.Bitcoin price crash wipes out 15 months’ gainsBitcoin’s drop to the $69,000–$70,000 range marked its lowest level in around 15 months, effectively erasing much of the progress made during the previous bull cycle.This decline pushed BTC back toward price zones last seen before institutional inflows and ETF-driven optimism reshaped market expectations.As the price broke below the key support level at $70,000, selling pressure intensified, and confidence among short-term traders deteriorated rapidly.The correction also dragged down major altcoins, reinforcing the idea that this was a market-wide deleveraging event rather than a Bitcoin-only move.From a market structure perspective, the fall represented a decisive break from the higher-highs and higher-lows pattern that had defined Bitcoin’s uptrend.Liquidations accelerate the sell-offOne of the most significant drivers behind the crash was a massive wave of forced liquidations across crypto derivatives markets.CoinGlass data shows that more than $840 million worth of leveraged positions were wiped out in a short period, with long positions accounting for the majority of losses.As Bitcoin slipped below critical price thresholds, automated liquidation engines kicked in, amplifying downside momentum.This cascade effect turned a controlled decline into a sharp flush, catching overleveraged traders off guard.The liquidation-heavy nature of the drop suggests the move was driven more by market positioning than by a single fundamental catalyst.After months of elevated leverage and crowded long trades, the market finally reached a breaking point.Massive Bitcoin outflows from exchangesAt the same time, on-chain data from CryptoQuant shows notable Bitcoin outflows from major exchanges, particularly Binance.Net Bitcoin inflowsBitcoin exchange netflow | Source: CryptoQuantA community-driven withdrawal campaign contributed to a sharp net outflow of BTC, briefly reducing exchange reserves.In a recent press release, Binance publicly addressed speculation about these movements, denying claims of financial instability and emphasising that withdrawals were proceeding normally.The exchange also encouraged users to practice self-custody if they felt uncertain, which further highlighted shifting trust dynamics within the market.Despite the price crash, some analysts view sustained exchange outflows as a sign that long-term holders are not panic-selling.This divergence between short-term trader behaviour and longer-term investor positioning adds complexity to the current market narrative.Bitcoin price forecast – what to look at in the coming daysLooking ahead, traders should closely watch several key levels as Bitcoin attempts to stabilise after the sell-off.The $70,000 zone now acts as immediate support, and a break below this level could push the price towards the $65,000 area, which stands out as a major support zone, as it aligns with previous consolidation ranges.BTC price analysisBTC price chart | Source: TradingViewA deeper breakdown could expose Bitcoin to a move toward the $60,000 psychological level, where buyers may attempt a stronger defence.On the upside, a sustained recovery above $72,000 would be an early sign that selling…
CoinJournal
SUI slides amid crypto selloff as HashKey Exchange confirms new listing
Sui traded around $1.13 as bulls looked to bounce off recent lows, and could ride HashKey Exchange listing to test key resistance
Ethereum price drops to $2,127 amid market weakness and high volatility.Vitalik Buterin sells $6.6M ETH, part of planned funding moves.Key support at $2,007, with resistance targets at $2,133 and $2,274.Ethereum (ETH) is under pressure as the cryptocurrency continues to face a significant pullback.The price of ETH has dropped to $2,098.91, down 5.6% in the last 24 hours.ETH price chartEthereum price analysis | Source: TradingViewThis decline is part of a broader downtrend, with Ethereum losing around 28% over the past week and nearly 34% over the past three months.Trading volume, however, remained elevated at $54.5 billion in the last 24 hours, highlighting strong market activity despite the falling prices.Vitalik Buterin’s ETH tradesAdding to the market concerns, Ethereum co-founder Vitalik Buterin has sold millions in ETH.Reports indicate that wallets linked to Buterin moved roughly 2,961.5 ETH, valued at approximately $6.6 million at the time of sale.vitalik.eth(@VitalikButerin) is dumping $ETH fast!Over the past 3 days, Vitalik has sold 2,961.5 $ETH($6.6M) at an average price of $2,228 — and the selling is still ongoing.https://t.co/Q9G1lEsdiP pic.twitter.com/C1vBn5UimJ— Lookonchain (@lookonchain) February 5, 2026These transactions attracted attention due to the timing of the Ethereum downturn.Additional reports highlight a separate $29 million ETH transfer, part of a planned reallocation by Buterin.The movement included converting ETH to wrapped ETH (wETH) and sending smaller amounts to his Kanro charity, which focuses on biotechnology and infectious disease research.Analysts stress that these transfers are likely strategic funding moves, not panic selling.Nevertheless, the market has interpreted these large movements as bearish signals.ETH price analysisEthereum has been under pressure due to broader crypto market weakness.The 24-hour price range for ETH is currently $2,077.42 to $2,258.21, reflecting volatility and uncertainty.Ethereum’s market capitalisation stands at $257 billion, with a circulating supply of 120.6 million ETH.The cryptocurrency is still down 57% from its all-time high of $4,946.05 in August 2025.Despite the decline, Ethereum remains a major player in the crypto ecosystem, with investors closely monitoring large wallet movements.Ethereum price forecastTraders are watching key levels for signs of market direction.The first support level to monitor is $2,007.If ETH fails to hold this level, it could drop further to the next support at $1,800.On the upside, $2,133 is the initial resistance level.A sustained break above this could push Ethereum toward $2,274, with the third resistance at $2,396.Analysts like CoinLore suggest that maintaining a price above the $2,007 support is critical for any potential recovery.Conversely, breaking below this level could accelerate selling pressure and test lower price floors.In conclusion, Ethereum faces a challenging period as both founder wallet activity and broader market trends weigh on the price.Traders should pay close attention to the support and resistance levels, as these will likely guide short-term movements in ETH.The post Ethereum price slips further as Vitalik Buterin dumps $6.6M ETH appeared first on CoinJournal.
via CoinJournal: Latest Crypto News, Altcoin News and Cryptocurrency Comparison https://coinjournal.net/news/ethereum-price-slips-further-as-vitalik-buterin-dumps-6-6m-eth/
via CoinJournal: Latest Crypto News, Altcoin News and Cryptocurrency Comparison https://coinjournal.net/news/ethereum-price-slips-further-as-vitalik-buterin-dumps-6-6m-eth/

Playnance unveils Web2-to-Web3 gaming infrastructure after years operating privately at scale.The platform processes 1.5 million daily on-chain transactions with over 10,000 active users.Playnance focuses on simplifying blockchain access through Web2-style onboarding systems.Playnance has made its first public announcement, revealing itself as a Web3 infrastructure and consumer platform company that has been operating a live ecosystem aimed at onboarding mainstream Web2 users into blockchain-based environments.The announcement was made on February 5, 2026, from Tel Aviv, marking the company’s first formal introduction after several years of developing and running its technology and platforms privately.Founded in 2020, Playnance has positioned itself as a Web2-to-Web3 gaming infrastructure layer.The company integrates with more than 30 game studios and enables the conversion of thousands of games into fully on-chain experiences, where all gameplay actions are executed and recorded directly on blockchain networks.Infrastructure built to simplify blockchain adoptionPlaynance’s core offering focuses on removing technical barriers commonly associated with blockchain usage.The company’s products are designed to allow users to interact with on-chain systems without needing direct knowledge of blockchain mechanics.Instead, users access platforms through familiar Web2-style interfaces, including standard account creation and login processes, while blockchain functionality operates in the background.The company stated that its live platforms currently process approximately 1.5 million on-chain transactions daily and support more than 10,000 daily active users.According to Playnance, a significant portion of its user base originates from traditional Web2 environments.These users are reportedly able to onboard and interact with blockchain-based systems without using external wallets or managing private keys, suggesting continued on-chain engagement from audiences outside the traditional crypto sector.The company’s ecosystem also includes the G Coin initiative, which is currently operating in pre-sale mode and is accessible through the Playnance official website.Consumer platforms showcase operational ecosystemPlaynance operates several consumer-facing platforms designed to demonstrate its infrastructure capabilities.Among these are PlayW3, Up vs Down, and other products that run on shared on-chain infrastructure and wallet systems.The integrated structure allows users to move between platforms without repeating onboarding procedures.All user interactions across these platforms are executed and recorded on-chain while remaining non-custodial, aligning with the company’s focus on user control and blockchain transparency.The shared wallet and infrastructure framework also supports cross-platform engagement within the broader Playnance ecosystem.“Our focus was on building systems that people could use without needing to understand blockchain mechanics,” said Pini Peter, CEO of Playnance. “We prioritized live operation and user behavior over public announcements, and this is the first time we are formally introducing the company after reaching scale.”Expansion strategy centred on user behaviourPlaynance stated that its infrastructure is designed to support high-volume consumer activity and continuous on-chain execution.The company’s approach reflects a broader industry shift toward practical blockchain applications targeting mainstream audiences.Looking ahead, Playnance indicated that its ecosystem expansion will be guided by observed user behaviour and platform performance.The company emphasised that its development roadmap will focus on real usage data rather than speculative adoption models.Playnance describes itself as a company focused on reducing friction between user behaviour and blockchain execution by operating consumer platforms at scale.The post Playnance unveils Web2-to-Web3 gaming ecosystem after years in stealth mode appeared first on CoinJournal.
via CoinJournal: Latest Crypto…
via CoinJournal: Latest Crypto…
CoinJournal
Playnance unveils Web2-to-Web3 gaming ecosystem after years in stealth mode
Playnance publicly launches its Web2-to-Web3 gaming infrastructure, revealing a live ecosystem enabling mainstream users to access on-chain platforms through familiar interfaces.