
In this video, you’ll find out about the Speed of Tape, a special indicator from the ATAS platform that monitors trading activity. You’ll see how useful it can be when placed on a non-standard chart type.
Examples show the logic behind the interpretation of the indicator readings.
🎥 Watch the video: https://youtu.be/5_cJw3So4VU
#tradingtips #speedoftape
Examples show the logic behind the interpretation of the indicator readings.
🎥 Watch the video: https://youtu.be/5_cJw3So4VU
#tradingtips #speedoftape
👍6🔥4
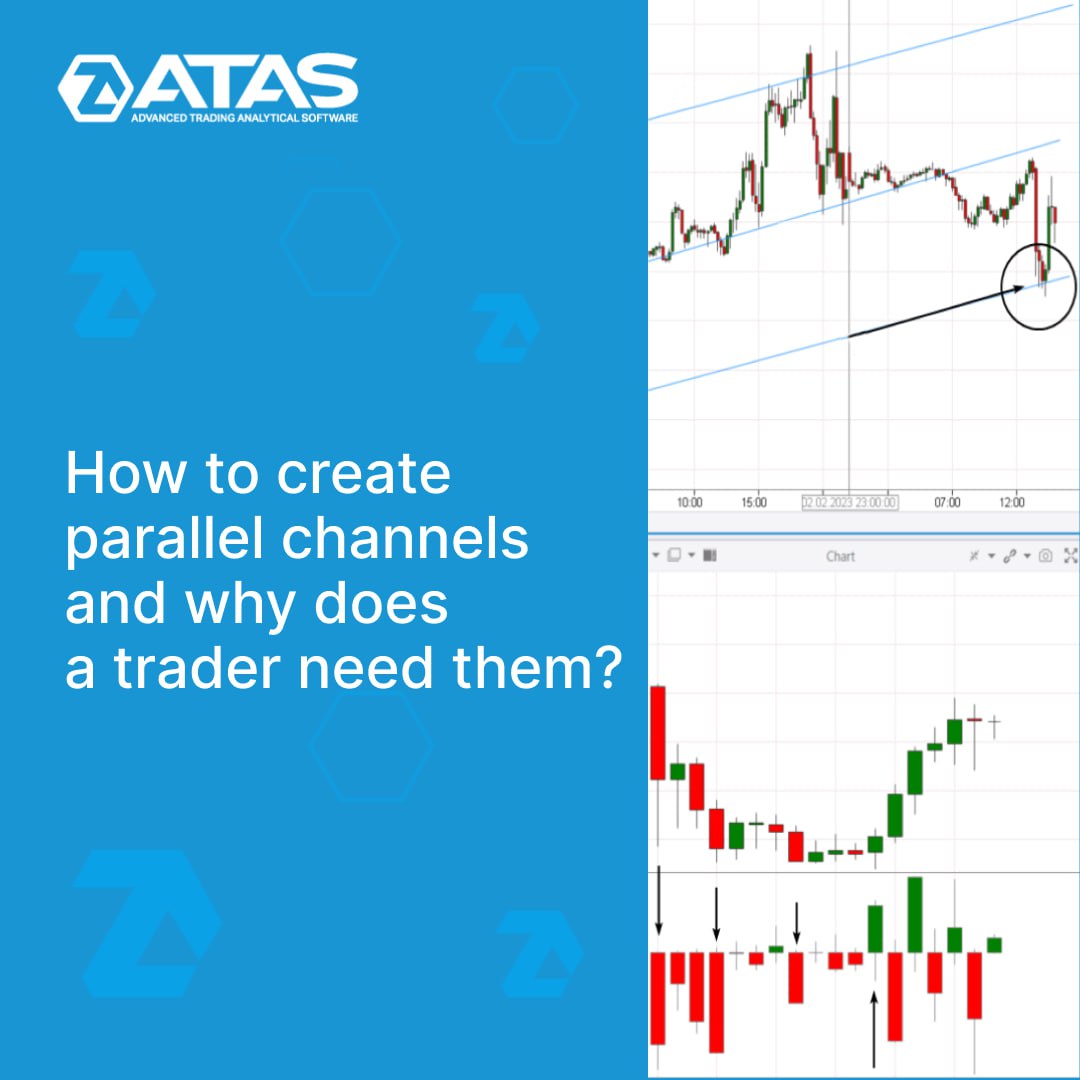
Parallel channels are probably an underrated pattern of technical analysis. When used with advanced ATAS volume analysis instruments, parallel channels can be the basis for developing your effective trading strategy.
👉 What parallel channels are
👉 Why they work, examples on history
👉 Advantages and disadvantages
👉 How to improve parallel channel trading with ATAS
👉 Final tips
Read a new article in our blog at the link ➡️ http://bit.ly/3Eiv87P. The article has detailed chart examples. Read for yourself and share with other traders.
#tradingtips #tradingstrategy #parallelchannels
👍7
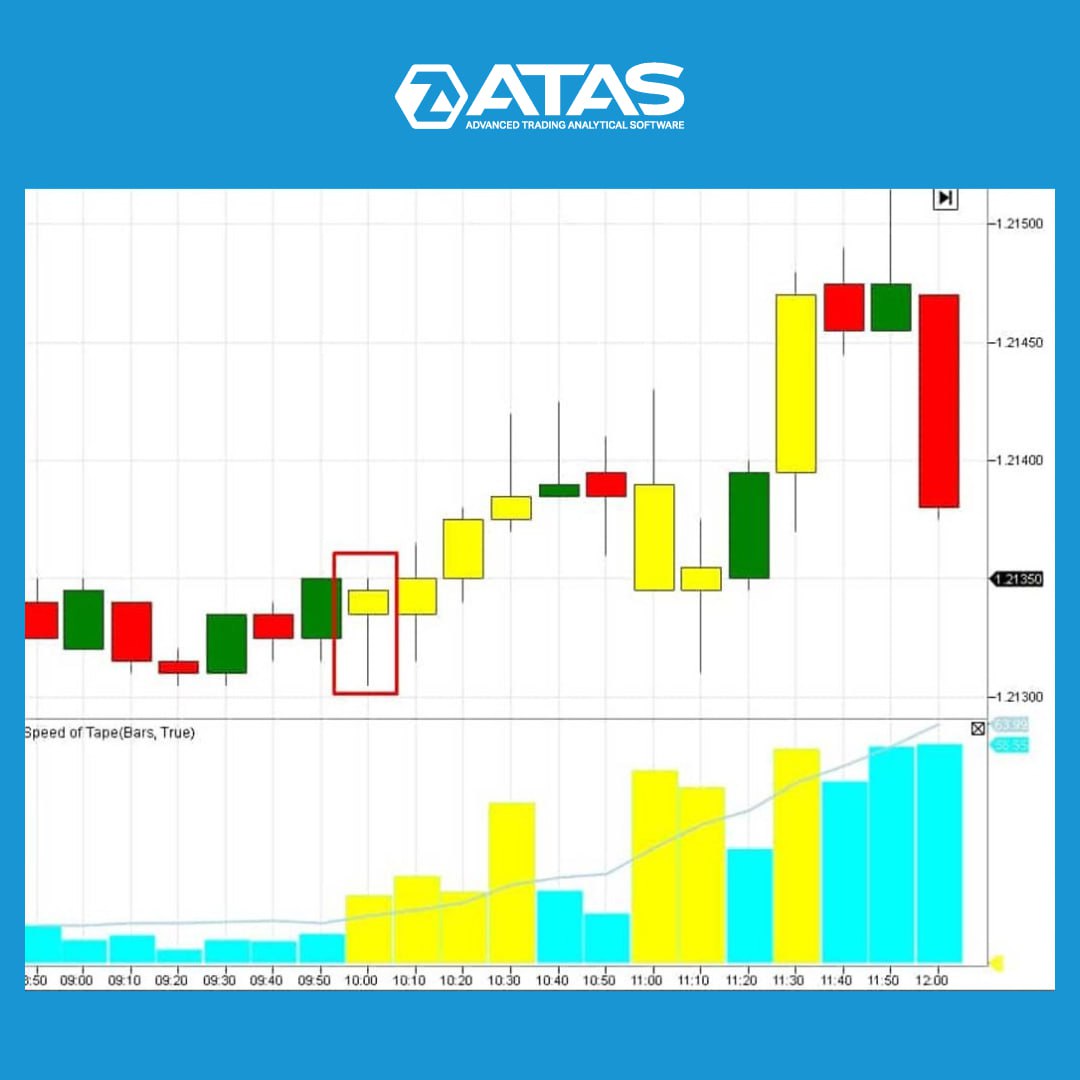
HOW TO PROFIT FROM MARKET INERTIA USING THE SPEED OF TAPE INDICATOR
The Speed of Tape indicator analyzes the Smart Tape. It highlights the bar where the Smart Tape speeds up. The analysis can be carried out according to:
✔️ ticks,
✔️ volume,
✔️ sell trades,
✔️ buy trades,
✔️ delta.
A bar could be the start of a short-term move. And since the market has inertia, the impulse can be continued.
👉 We are going to look for the beginning of the impulse on the 6E futures (EURUSD) ans use non-standart time frame М10. We should look for the first candle highlighted by the Speed of Tape indicator at the beginning of the European session.
If this candle is moving in the direction of the trend, this point can be considered the first impulse. There is a good chance that this impulse will continue.
Read more about installing and interpreting the Speed of Tape indicator in the article at the link: http://bit.ly/3KY2T2m
#tradingtips #speedoftape
👍6🔥4👏1
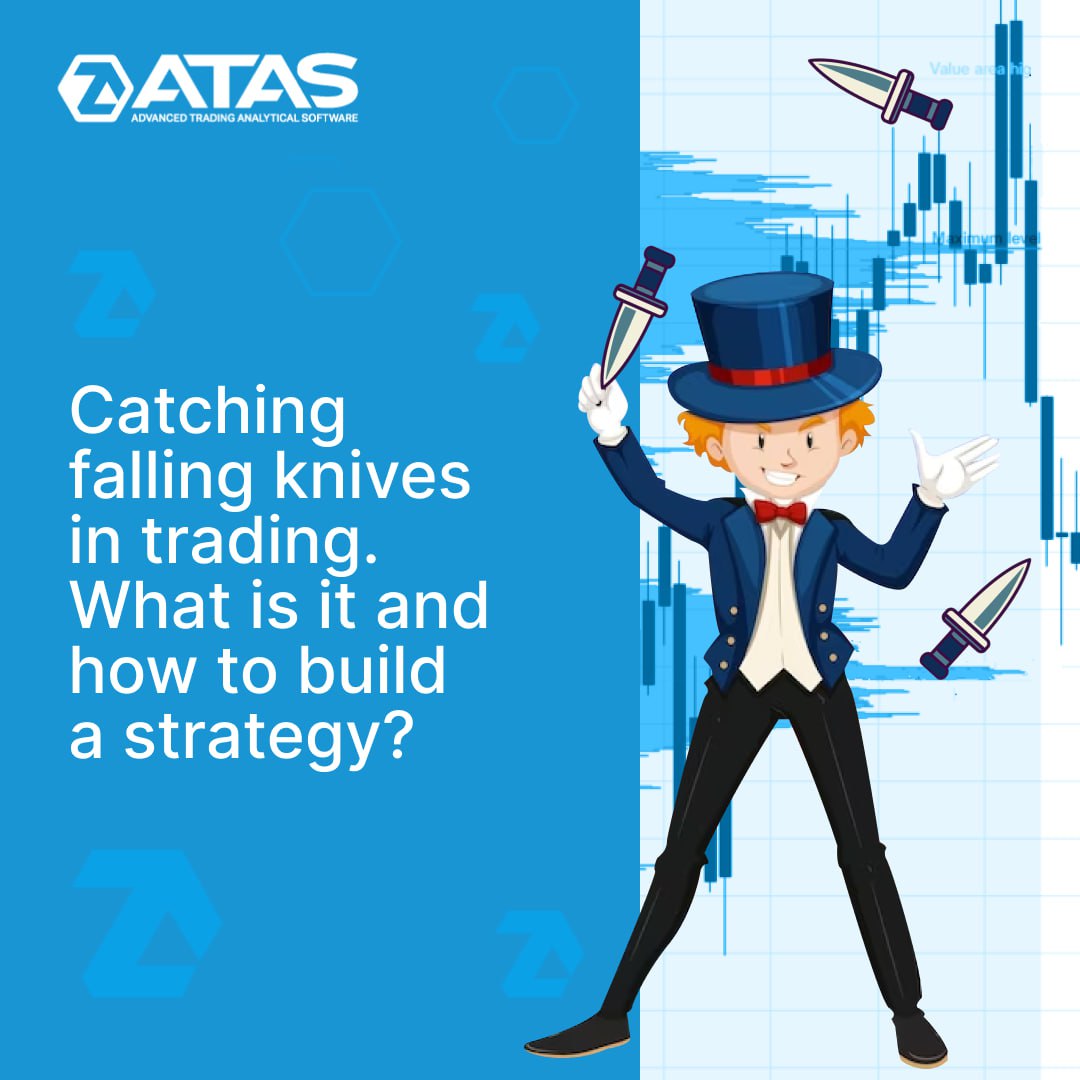
Catching a falling knife is a term used to describe the situation when a trader is trying to buy a stock, futures or cryptocurrency at the moment of its rapid price drop.
Read in a new article on our blog http://bit.ly/3ZTFzqS:
👉 Examples of falling knives
👉 Does the strategy of catching falling knives make any sense?
👉 How to reduce risks with ATAS
The article has detailed chart examples and is designed to reduce the danger that lies behind the reckless desire to catch a falling knife. Read for yourself and share with other traders.
#tradingtips #tradingstrategy #fallingknives
👍3🔥1
Friends,
The ATAS's representative, Michael Burgstaller, will be a guest at The Trading Pit booth at Invest Expo, Stuttgart, on March 18. His working languages are English and German.
Michael will answer all your questions about the ATAS platform in detail and tell you about the features and useful platform instruments. Also, you have a chance to learn more about the plans of ATAS and The Trading Pit companies, new offers and how we partner up.
Visit this event, and let's talk in person!
Location: Landesmesse Stuttgart GmbH, Messepiazza 1, 70629 Stuttgart, Germany
Dates: 18 March 2023
Hall/Stand no: 4C80
#webinar
👍5🔥4❤2
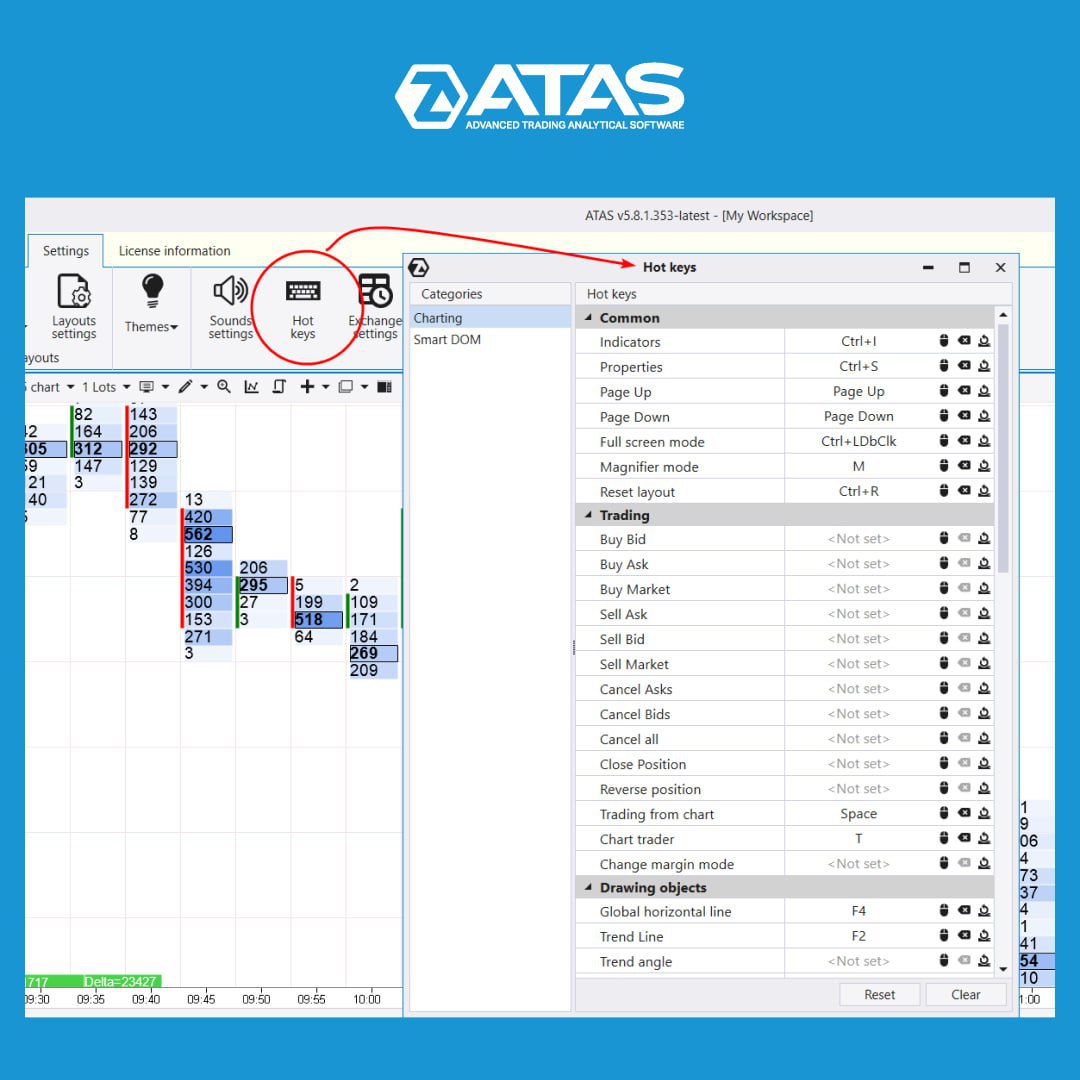
HOT KEYS
ATAS is a highly customizable software product. You can customize workspaces, charts, colors, and much more, including hot keys.
Hot keys are a predefined combination of buttons on the keyboard, when they are pressed, the platform performs the desired action. This makes working in ATAS:
✅easier;
✅faster (speed is especially important for scalpers);
✅safer (the impact of the human factor is decreased).
To customize hot keys, click the corresponding icon in the menu of the main platform window (on the Settings tab). There are 2 categories of hot keys in the window that opens:
➡️for the chart;
➡️for the DOM.
Many combinations are already preset. You can either disable/change them, or set your own settings by linking certain platform actions to a key combination.
You can also assign specific actions for the mouse, such as double-clicking.
We hope that this simple and useful feature will help you work effectively. Download ATAS now and start trading at a new level!
http://bit.ly/3F0nxer
#tradingtips #hotkeys
👍6❤4
HOW TO TRADE A SHORT SQUEEZE?
Take a lemon and squeeze it. The juice will begin to run out.
Similarly, the invisible hand of the market squeezes money out of short sellers during a bullish breakout.
✔️ An extremely high value of short positions could be a sign of a Short Squeeze. % of short positions is a number of short positions divided into the number of stocks in circulation. Stocks that have this figure above 10% have more potential.
✔️ SIR (the number of days required for closing all short positions) should be >5. This means that the number of short positions must exceed the average daily volume by more than 5 times. Having this ration, short sellers can start panicking if the price rises sharply.
✔️ You can use technical analysis indicators to filter stocks. For example, SMA (50) or VWAP. Prices should be higher than the indicators, there must be a clear uptrend on a larger time frame.
✔️ The opening gap >2% will also increase chances for a profitable trade.
More info: http://bit.ly/3yfPATy
#tradingtips #indicators #shortsqueeze
👍6❤3
🎬 New video on the ATAS channel!
This video will be helpful for beginners who want to understand footprints.
And for experienced traders who want to master professional instruments for analyzing stock charts.
👉 What red and green colors mean
👉 how to analyze these clusters to make a trading decision
Watch video ➡️ https://youtu.be/Mbll75A30VE
#tradingtips #bidask
YouTube
Introduction to exchange trading: Bids & Asks
📌Do you want to trade successfully?
Download ATAS for free with full functionality: http://bit.ly/3GmzcoA
This video is for those who are interested in cluster charts and we're going to:
- tell you what red and green colors mean. These colors are most often…
Download ATAS for free with full functionality: http://bit.ly/3GmzcoA
This video is for those who are interested in cluster charts and we're going to:
- tell you what red and green colors mean. These colors are most often…
👍3🔥2❤1
🔥 HOT NEW FEATURE IN ATAS - HEATMAP 🔥
Heatmap is a convenient way to display trading activity in the DOM over time. The enhanced Heatmap provides more useful features to ATAS platform users working with Scalping DOM and DOM Levels indicators.
Learn more about the new functionality from the video link https://youtu.be/rtJun_s5h38:
👉 What is a Heatmap, and how does it work?
👉 Heatmap settings using Scalping DOM as an example.
#ATASupdate #heatmap #tradingtips
🔥10❤3🤩2
🎬 New video on the ATAS channel
How to connect the platform to Binance
This video will show you how to connect the ATAS platform to the Binance exchange, particularly for futures trading.
Watch the video ➡️ https://youtu.be/WTRW1QgM4Us
#crypto #cryptocurrency #binance
How to connect the platform to Binance
This video will show you how to connect the ATAS platform to the Binance exchange, particularly for futures trading.
Watch the video ➡️ https://youtu.be/WTRW1QgM4Us
#crypto #cryptocurrency #binance
❤2
🔥A hot new feature in the ATAS platform - Heatmap!
The ATAS Heatmap features:
✅ it is built in DomTrader and DOM Levels indicators
✅ it allows you to disclose the intentions of a big player
✅ it allows you to scalp and look for precise entry/exit points
✅ it is available in the Market Replay mode
✅ it is smooth, and it has beautiful gradients
In a new article on the ATAS blog https://bit.ly/3nu10RN, you can learn about how to use a heat map and watch a tutorial.
Share this good news with other traders!
#heatmap #domlevels #domtrader
#ATASupdate #heatmap #tradingtips
❤5🔥2
We would like to present you Latest 6.0.2.322
New functionality:
✅ A new heat map for Dom Levels and Scalping Dom (only with OpenGL Skia).
Improvements and optimizations:
✅Rithmic connector has been updated to a new version.
✅Market Power, Multi-Market Power, and Cumulative Delta indicators have been renamed to CVD pro, CVD pro (multi) and Cumulative Volume Delta.
✅The Market Replay history playback is paused when opening the settings window of indicators/strategies.
✅Time Filter and Calculation settings have been removed from the Bars Volume Filter indicator.
✅You can set the line colour based on the direction in VWAP/TWAP and EMA indicators.
✅You can choose a volume mode in the VWAP indicator.
✅Arrow display in the Swing High and Low indicator has been optimized.
Fixes:
✅We have fixed Delta, Cluster Statistics, Volume indicator settings, display of Cluster Search, Market Profile and Delta indicator, problems with the connection to Bybit and DxFeed and many more issues.
Read more https://bit.ly/3VQkUDi
#ATASupdate
❤9👍1
UPDATED CONTEXT MENU
You may have noticed that the top menu of the chart window on the right appears a bit "empty" now. It no longer includes:
1️⃣ Button for creating linked windows
2️⃣ Button for cloning windows
The top menu was overcrowded, some elements couldn’t possibly fit within the narrow chart window. Buttons were automatically hidden in a dropdown menu, which was inconvenient and not visually appealing.
We have moved the mentioned useful buttons to the context menu. You can open it by right-clicking on the chart.
You can find information about a linked window and how to use it in the article about the benefits of working with charts (”Linking to the Tape” text block) ➡️ https://bit.ly/3WlwQxi
#tradingtips #ATASupdate #workspace
👍2🔥1
⏰ CLOCK IN MARKET REPLAY
Market Replay is a simulator for a trader that gives maximum freedom for working with time. You can:
👉 choose a date to start replaying trades;
👉 speed up/slow down the playback from x0.1 to x50;
👉 pause the replay.
With the clock feature, you can specify the exact start time of the replay with minute-level precision! This is very useful if, for example, you need to skip a sluggish Asian session and start practising closer to the beginning of the American session (indicated by the arrow) when the price is most actively changing.
Save time by improving your trading level with the powerful Market Replay!
You can find more information on how to use the simulator in a special article on our blog at the link: https://bit.ly/3ocMJtd
#replay #ATASupdate #tradingtips
❤6👍3
TOP 5 TIPS FOR FOOTPRINT ANALYSIS
1️⃣ Pay attention to the zeros in one of the columns of the footprint during sudden market movements. If they appear, it is likely that stop-losses have been triggered
2️⃣ Pay attention to where the candle has closed relative to the maximum volume in the footprint. This will indicate the current market dynamics.
3️⃣ Note significant clusters of volume in the tails of candles. Very often, the price continues to move in the direction of the candle’s closing.
4️⃣ Keep an eye on the imbalance of trades in either the Bid or Ask column of the footprint. A clear imbalance can indicate the current market dynamics.
5️⃣ Analyze footprint (cluster) on Range charts. You will often be able to see large clusters that are not visible on the time charts.
The ATAS platform enables you to see exchange processes from the inside. A footprint is one of the main instruments in a successful trader's arsenal. Learn how to read footprints from scratch with our article https://bit.ly/43qQElC
#footprint #tradingtips #rangeus #bidask
👍3❤1🔥1🎉1
THREE WAYS TO IDENTIFY AN UPCOMING REVERSE WHILE EVALUATING MARKET WAVES
1️⃣ Estimate the size of a pullback using Fibonacci numbers: 38,2%, 50%, 61,8%
2️⃣ Count the number of waves. They should be approximately:
👉 3-4 when trading in a range;
👉 more than 4 when trend trading.
3️⃣ Assess the overall context. Use the volume profile and other indicators to confirm the trend reversal.
What are the Fibonacci numbers, and do they really have a “magic” power over the market? Read the article at the link https://bit.ly/3IOKt2s
#zigzag #tradingpatterns #technicalanalysis #fibonacci
👍7❤1🤔1
Working with order flow is not a mechanical approach to opening trades based on some specific signal like MA (Moving Average) and price crossing. Understanding the order flow allows a trader to decide whether it makes sense to enter a trade at this level and whether it makes sense to hold the work if the trader is already in it.
Read the article at the link https://bit.ly/3XfhCdE:
👉 What is the order flow?
👉 What do traders use the order flow for?
👉 Why do prices move and stop?
👉 Components of the order flow
👉 What price movements are seen better on order flow than on the candle chart?
👉 Footprint examples
👉 Examples with the delta and cumulative delta
👉 Examples in Smart DOM, Smart Tape, and Spread Tape
👉 Examples with the Market Profile
#tradingtips #volumeanalysis #tradingstrategy #orderflow #cumulativedelta #smartdom #smarttape #spreadtape #tpoandprofile #footprint
👍8🔥1
RULES FOR BUILDING RANGE US CANDLES
Three parameters are used for building candles in RangeUS chart format:
⠀
1️⃣ Tick Trend is the distance at which a trending candle will be formed and closed. The distance is measured either upward or downward.
⠀
2️⃣ Tick Reversal is the distance at which a reverse candle will be formed and closed. There is one prerequisite for a closing - the price must move in the opposite direction to the previous candle.⠀
3️⃣ Open Offset is the distance from the start of the session at which the first candle is drawn. Using this parameter affects the entire chart as it shifts hard boundaries.
The picture presents an example of building the RangeUS with the following parameters: Tick Trend – 10 and Tick Reversal – 5 for a 6E futures.
You can find more information about the capabilities of RangeUS and how to combine a chart with Delta and other indicators of volume and technical analysis in an article at the link: https://bit.ly/3MKsqeR
#rangeus #charts #tradingtips
👍11❤2