WHAT IS VSA DISTRIBUTION
Distribution is a trading range at the market highs in which a financial instrument changes its owner. As a rule, the major interest (insider, smart money or composite operator) uses the current market situation in order to distribute the asset they own at high prices.
The general features are the following:
👉 An extremely powerful upward impulse passes at the beginning of the distribution area. Usually it is accompanied with good news in the media. A major player sort of advertises stock/futures/currency in order to make minor players snap the instrument up like hot cakes. From the VSA point of view, an analyst registers the buying climax and/or the End of Rising Market.
👉 Then the buyers’ pressure exhausts. The upward waves become less powerful. New highs are just a situational overrun of previous records. The major player provides false support to the market only to buy time and sell more.
👉 Downward movement starts on the growing volume (Selling Pressure) after the final false upward movement (Upthrust) and is accompanied with weak rallies (No Demand).
👉 As for the stock market, the stock becomes weaker than the index.
Find more information about VSA in our blog at the link in a bio.
Support service bot
Chat group for communication
👍7
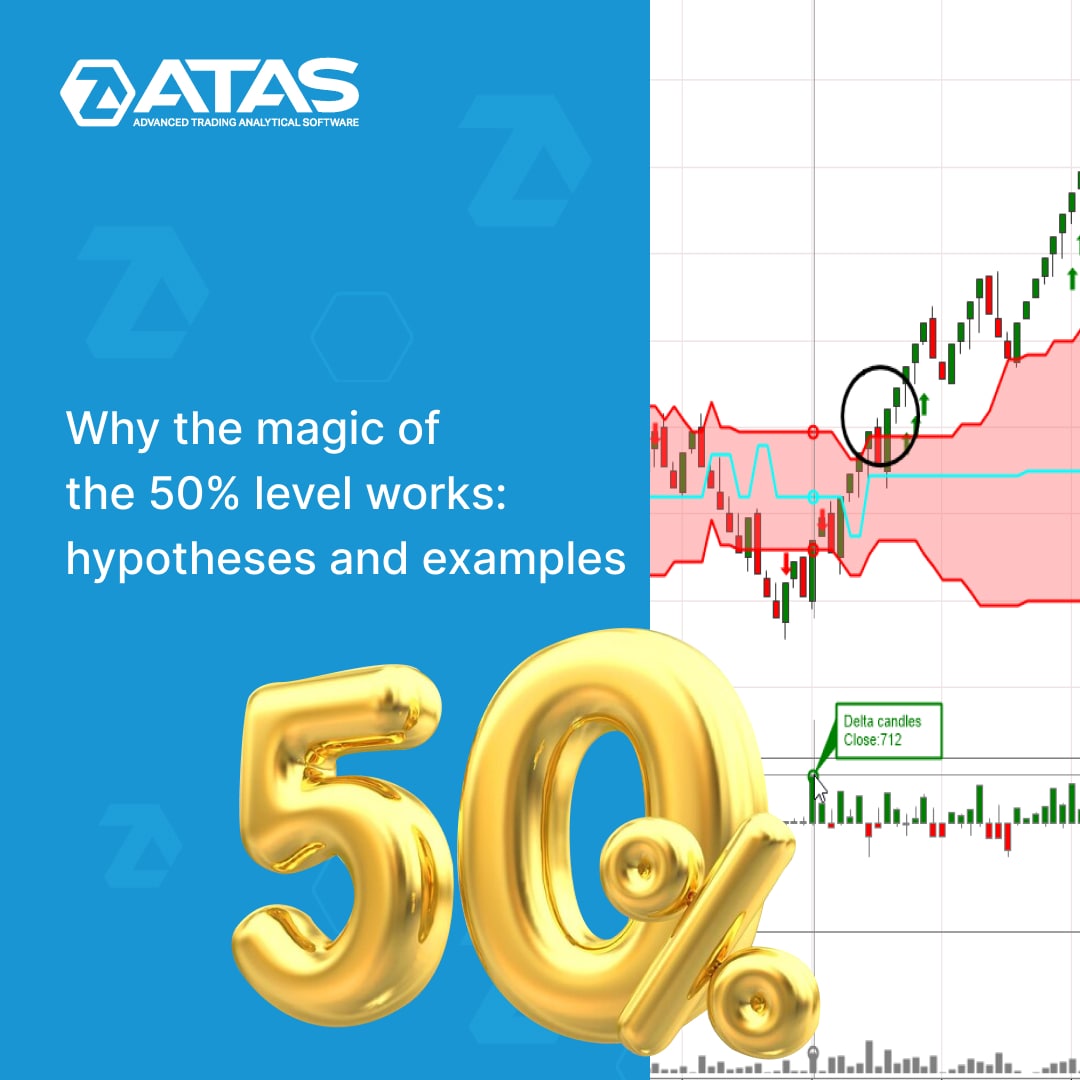
50% is a simple technique that can be used even by a beginner trader. At the same time, the professionals’ experience confirms that it is very effective.
By using 50% retracements, traders can find entry and exit points, improve the accuracy of trading decisions and reduce risks on any time frames.
We have collected comprehensive information about the 50% level in a new article in our blog.
👉 what is the 50% retracement;
👉 how traders should use retracements to make a profit;
👉 thoughts on the nature of the phenomenon;
👉 why the 50% level works – three hypotheses.
Find out in detail at the link https://bit.ly/3Buarn6
The article has detailed chart examples. Read for yourself and share with other traders.
Support service bot
Chat group for communication
👍5
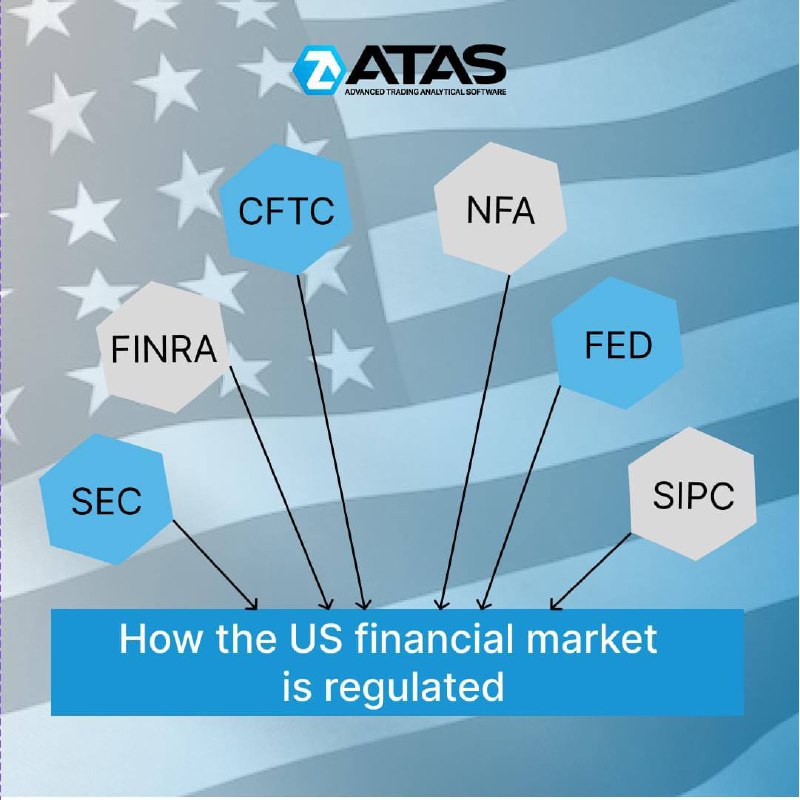
HOW THE US FINANCIAL MARKET IS REGULATED
Financial Supervisory Authorities (regulators) ensure that market participants do not violate the rules, and that trading is carried out honestly and transparently.
For example, trading in the US financial markets is regulated by:
👉 SEC (The United States Securities and Exchange Commission, founded in 1934 under President Roosevelt) is an agency of the US government. It is the main body that oversees and regulates the US securities market.
👉 FINRA (Financial Industry Regulatory Authority) – is a private American corporation that enforces the rules of trading in the over-the-counter market (OTC market). It was created in 1939 by the decision of the US Congress.
👉 CFTC (Commodity Futures Trading Commission). The central government agency of the USA that ensures the enforcement of the Commodity Exchange Act.
👉 NFA is the National Futures Association founded in 1984. It is a regulator in the derivatives markets, including the market of exchange-traded index futures. The NFA is funded by membership and evaluation fees and membership is mandatory for many market participants.
👉 FED (Federal Reserve System) is not a classic regulator, but the relevant rules approved by the Fed must be followed by financial market participants.
👉 SIPC is the Securities Investor Protection Corporation. It was created under the Securities Investor Protection Act (SIPA) in 1970. SIPC is also not exactly a regulator, it is controlled by the Securities and Exchange Commission. The purpose of SIPC is to expedite the recovery and return of client’s missing assets during the liquidation of a bankrupt investment company.
Read the article to learn more about the specifics of US stock trading: https://bit.ly/3xWs4ez
Support service bot
Chat group for communication
👍7
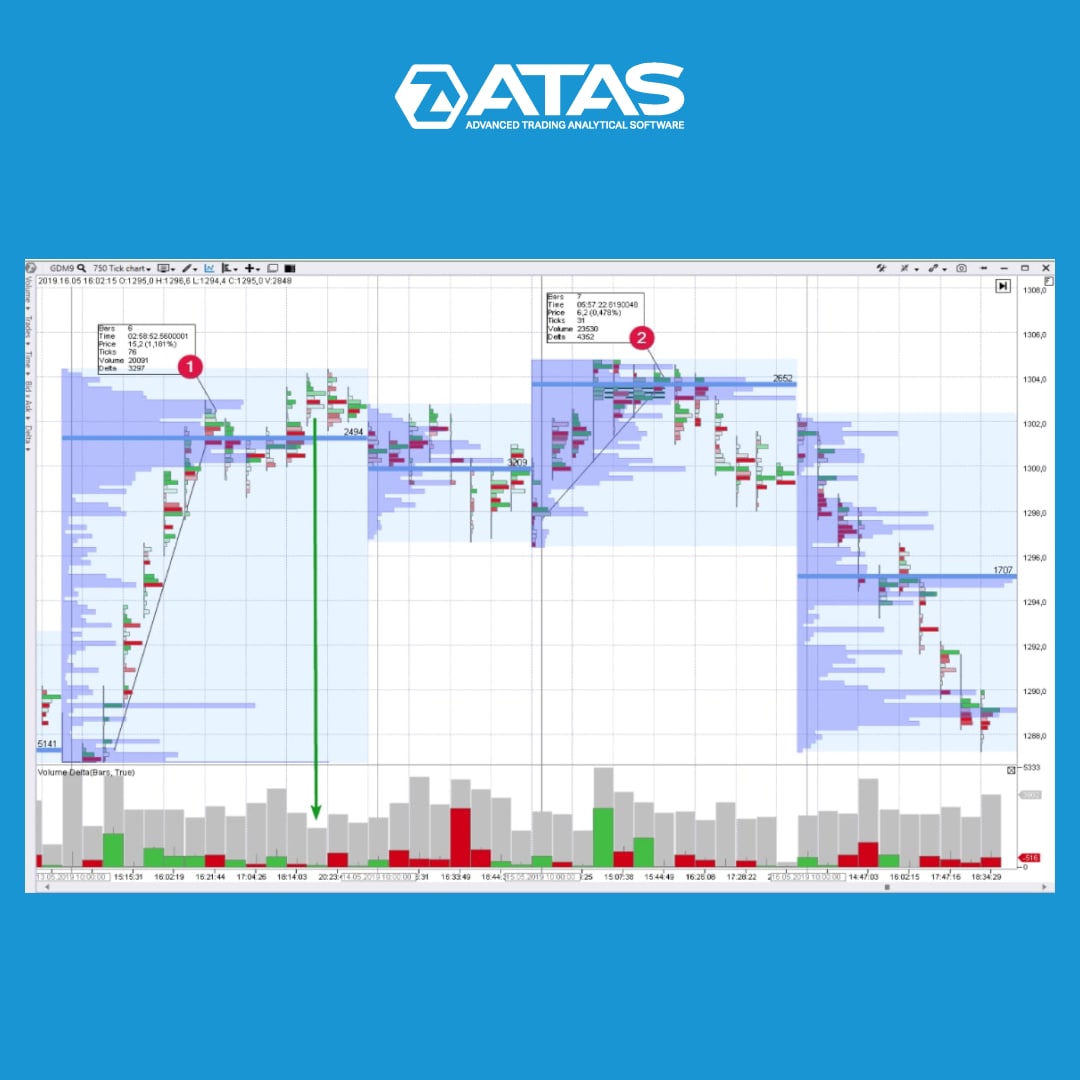
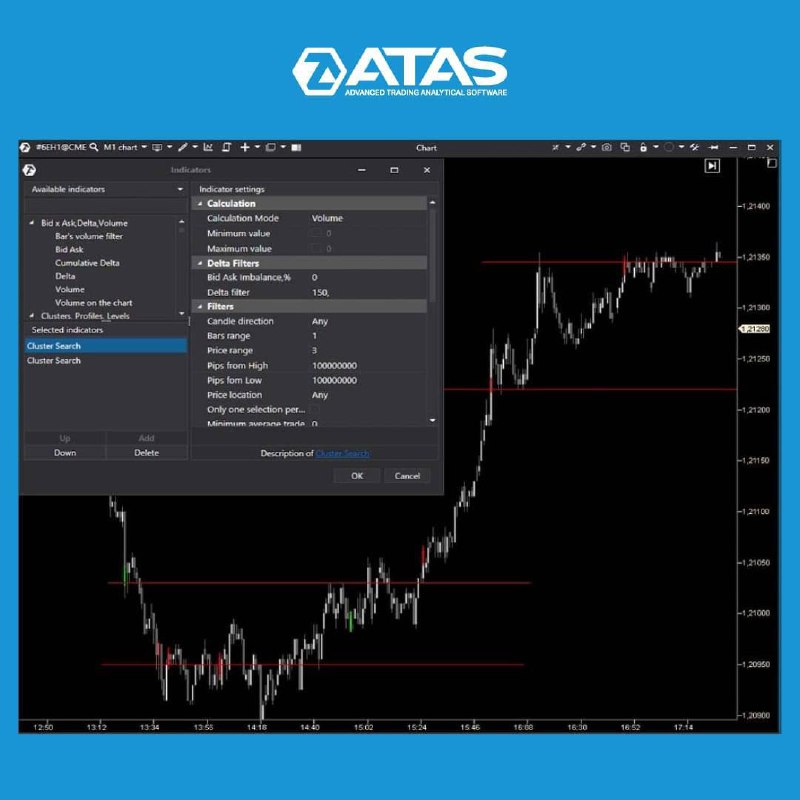
HOW TO FIND TRACES OF “SMART MONEY” USING THE CLUSTER SEARCH INDICATOR IN ATAS
It is very important for traders to decide at what levels they will trade. We are going to look at big trades and the limit side of the trade using the Cluster Search indicator.
We are going to use two Cluster Search indicators to find levels where a fierce battle between buyers and sellers took place.
Market orders are often absorbed by limit orders at the end of a focused movement and as a result the price reverses. These are the levels that the Cluster Search indicator can detect. If you want to separate the European and American sessions, it is necessary to use four indicators. Two for each session – one for buys and the other one for sells.
Learn more about the cluster analysis and Cluster Search indicator at the link: https://bit.ly/3rts5TE
Support service bot
Chat group for communication
👍5🔥3
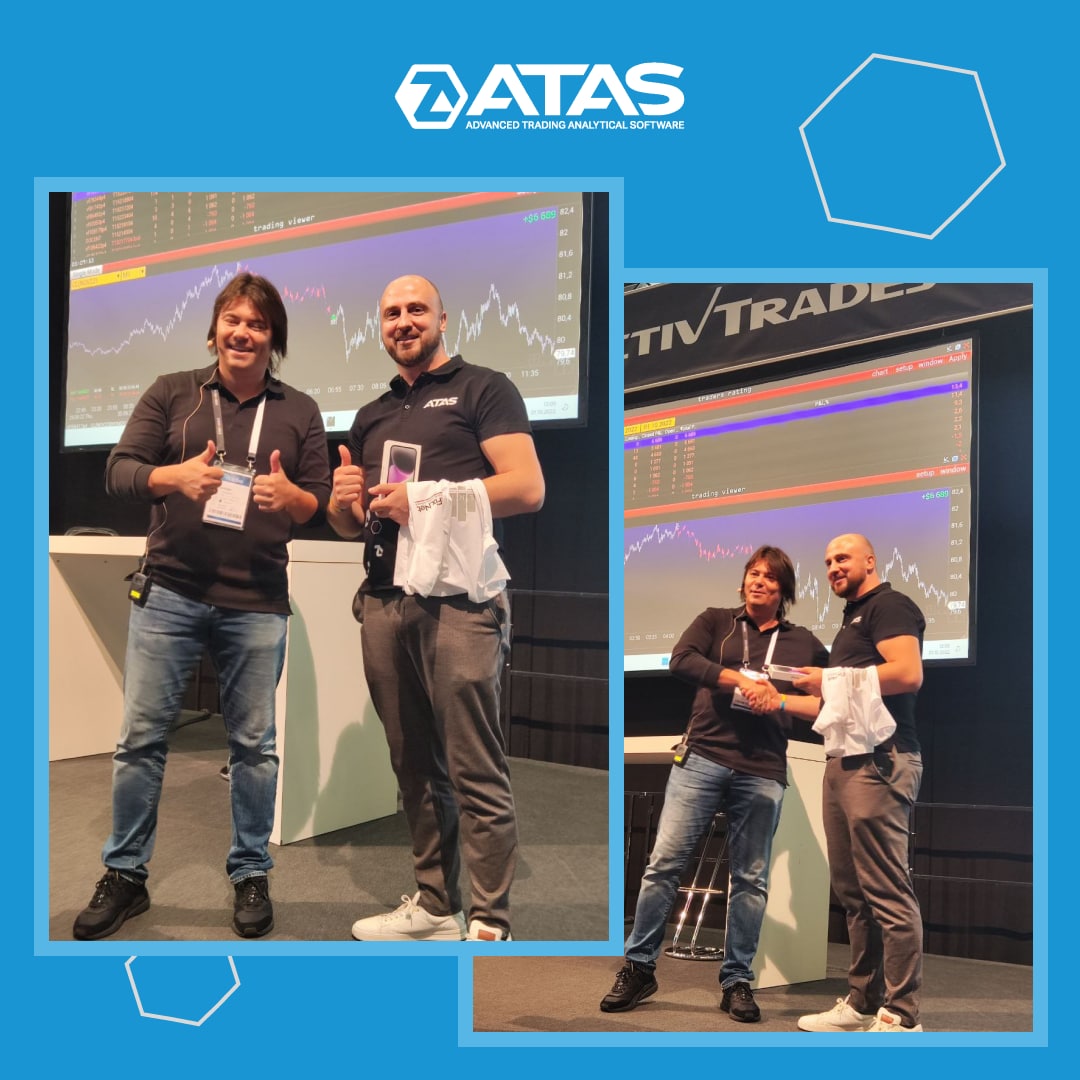
ATAS IS CONQUERING THE WORLD OF TRADING
Dear friends, we would like to share a photo report from Frankfurt am Main, Germany, where the World of Trading conference was held.
WoT is an annual prestigious exhibition and conference that brings together leading representatives of the trade industry in Frankfurt am Main. This time, representatives from more than 60 stock exchanges, brokers, software vendors, educational companies, specialized publishers and online resources met to exchange ideas.
The ATAS team presented the functionality of the platform to the public and received a lot of positive feedback! This motivates us to develop, improve trading instruments and the quality of service for our clients.
Moreover, we went even further and won a trading competition organized by colleagues from VolFix. The ATAS team is always ready to demonstrate the analytical power of the platform in practice! As Vasyl Gryshchenko, the Founder and CEO of VolFix, noted: VOLUME ALWAYS WINS!
👏8👍3
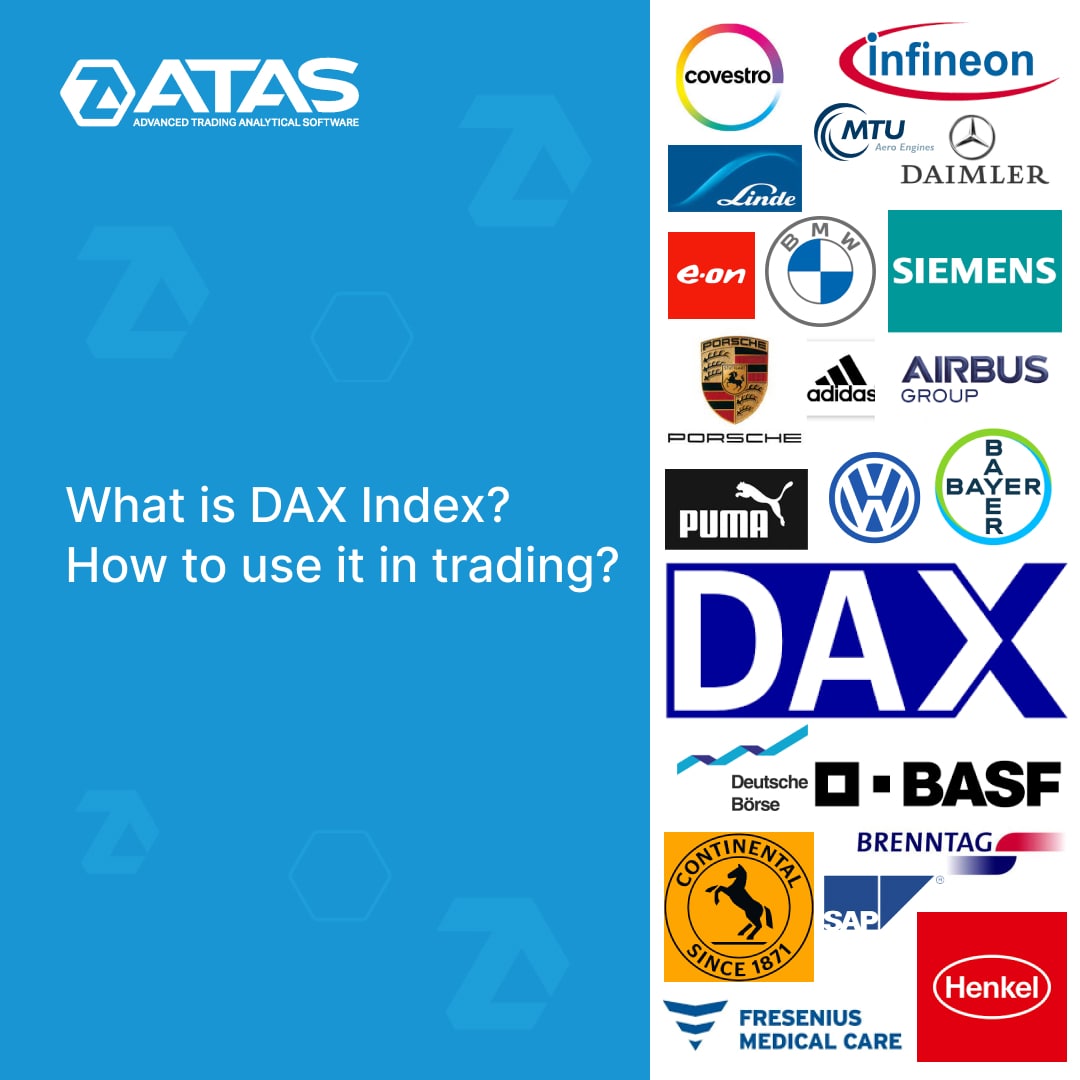
In the stock market October is known as a "bear market killer". According to statistics, October is the month when prolonged declines of the stock market usually end.
There is every reason to believe that the beginning of October will continue the tradition. We can see upward reversals on the charts of all major stock indices, including the DAX 🇩🇪.
If you do not know what the DAX is, a new article will give you the answers: https://bit.ly/3SY8FSO
Support service bot
Chat group for communication
👍4❤3
ABOUT CLEARING IN LAYMAN’S TERMS
Clearing on the exchange is the time for non-cash settlements between the accounts of market participants.
👉 To go through clearing, you must have funds on your trading account to ensure the result of the transaction (if it is negative) and a security margin, which is set not by the broker but by the exchange itself. If the time of clearing has come but you do not have enough free funds on your account to ensure an open position when transferring through clearing, the position will be closed at an average daily price which is much worse than the market price, and a fine will also be imposed. Therefore, be careful when transferring a position through clearing!
☝️ Here is a quick reference that will help you not to get confused in terms:
Intraday Margin is set by the broker intraday.
Initial Margin is a sum on the balance that is necessary for transferring the contract through the night on the FIRST day!
Maintenance Margin – is a sum on the balance that is necessary for transferring the position overnight on the second and subsequent days.
To learn more about the margin required to transfer a clearing position, read the article:
https://bit.ly/3yGCuiV
Support service bot
Chat group for communication
👍4
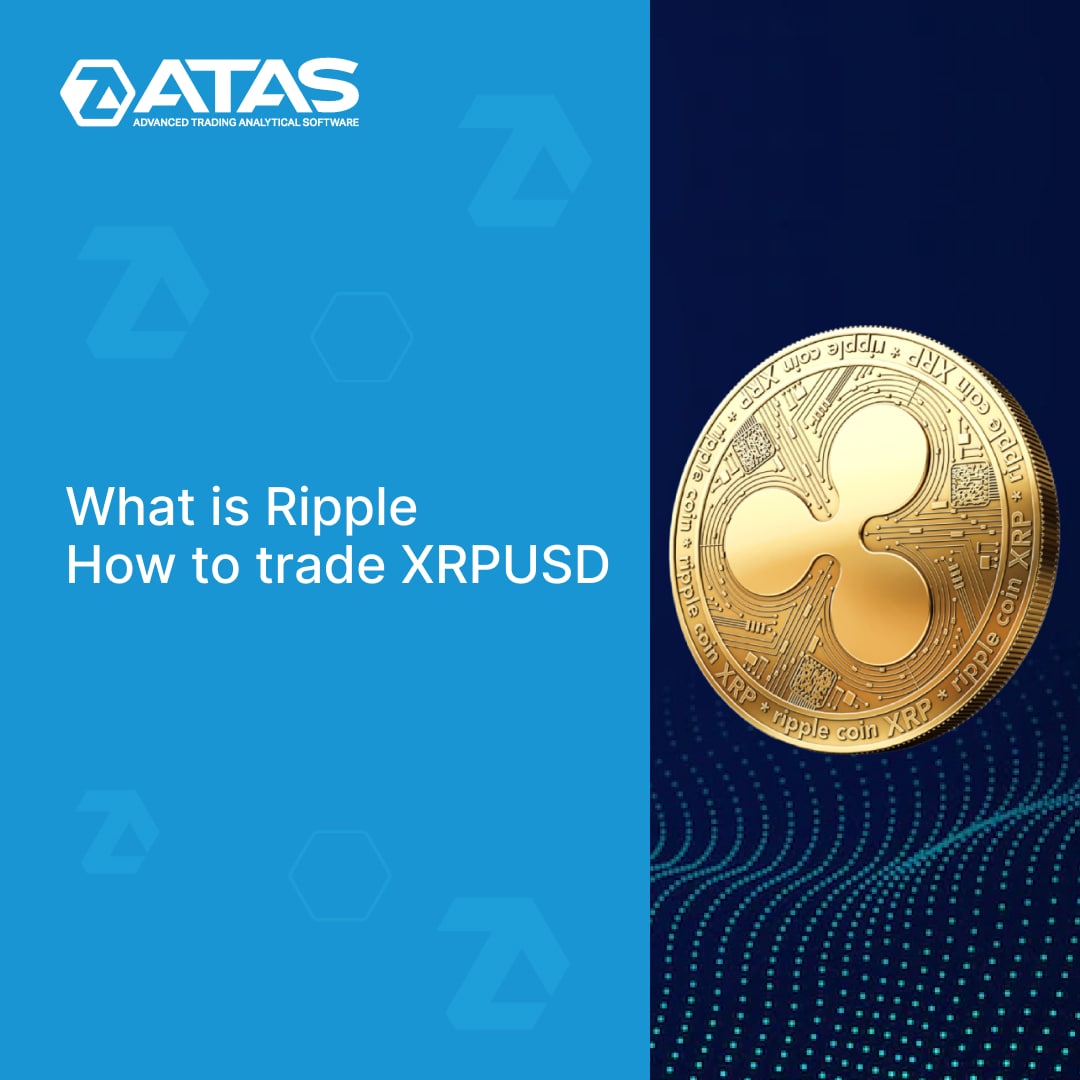
Fall 2022 could be an important period for crypto firm Ripple Labs, which has been in a state of court with the SEC regulator for about 2 years now. There is news that the court may decide in favor of Ripple. There will be several important dates before the end of the year, and the head of Ripple Labs, Brad Garlinghouse, believes that the lawsuit will end in early 2023.
Against the backdrop of this news, the XRP/USD rate rose strongly in September, attracting traders. Is it not in a trap?
A new article on our blog tells about what XRP is: https://bit.ly/3VNoXA2
Support service bot
Chat group for communication
Against the backdrop of this news, the XRP/USD rate rose strongly in September, attracting traders. Is it not in a trap?
A new article on our blog tells about what XRP is: https://bit.ly/3VNoXA2
Support service bot
Chat group for communication
👍6👏1
RISK CALCULATION
Risk Calculation is a super useful feature for risk management.
Are you planning to open a purchase? Select Long Position from the drawing tools menu → a tool will appear on the chart to calculate the ratio of the possible reward to the risk taken.
Set levels:
👉 entering a position;
👉 take profit level;
👉 stop loss level.
The ATAS platform will calculate the Risk:Reward ratio for you. It is desirable that it exceeds the ratio of 1:2.
This tool will also be useful for developing strategies based on historical data.
Do not neglect routine, but vital calculations. Keep risks under control! The ATAS platform will help you with this.
Read more life hacks from professional traders in our blog https://bit.ly/3DCHA2t
Support service bot
Chat group for communication
👍5🔥2
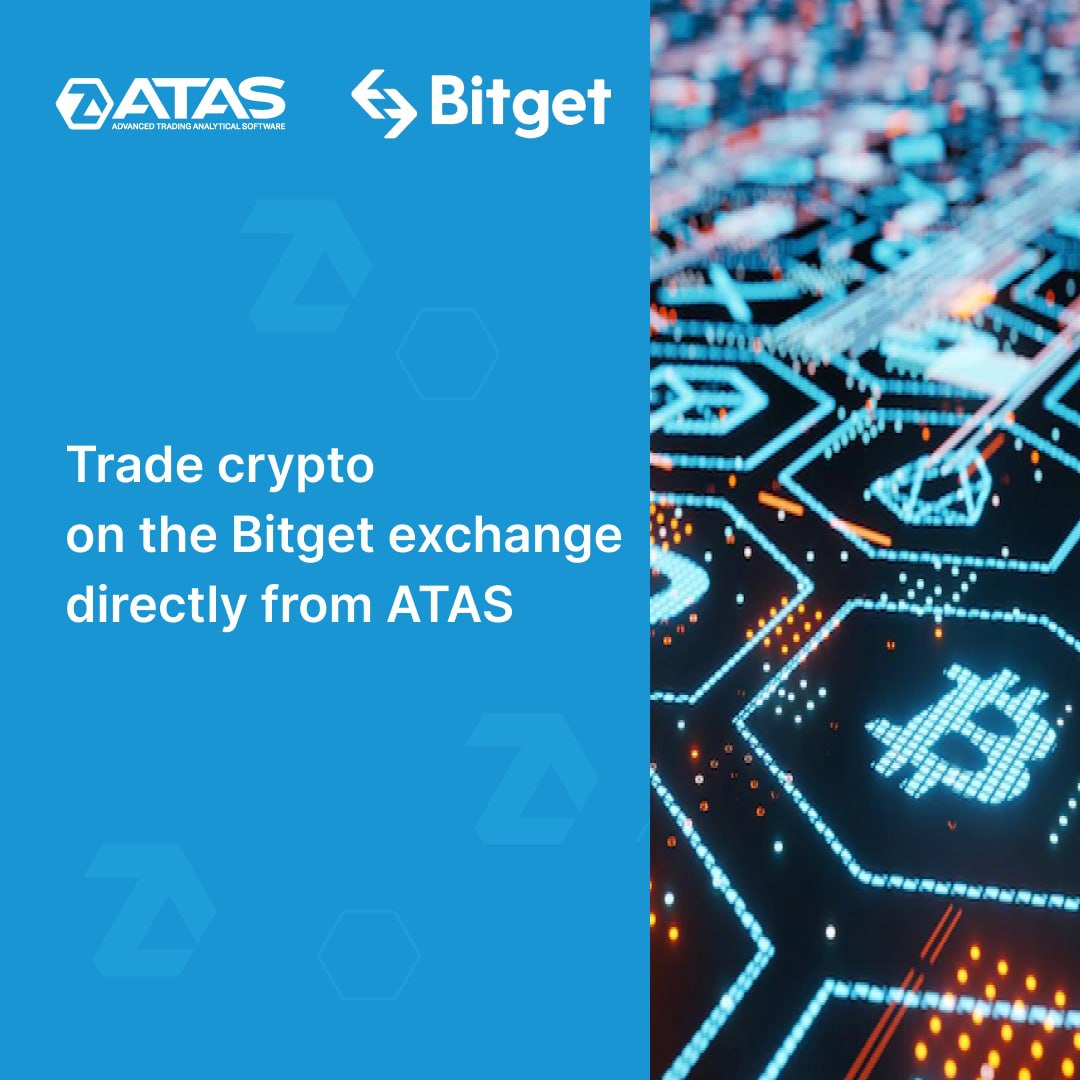
Fall of 2022. Leading cryptocurrency exchange Bitget announces a partnership with Lionel Messi, the legendary Argentine footballer and winner of a record seven Ballon d'Or awards.
Meanwhile, the ATAS team announces that a connector to the Bitget exchange has been added to the platform. Now ATAS users can use powerful volume analysis instruments to trade on another promising cryptocurrency exchange.
Detailed instructions for connecting to Bitget can be found in the article at the link: https://bit.ly/3SQFErm
Share the news with those who are interested in professional cryptocurrency trading. The ATAS platform expands the opportunities for crypto traders!
Support service bot
Chat group for communication
🔥3👏2👍1
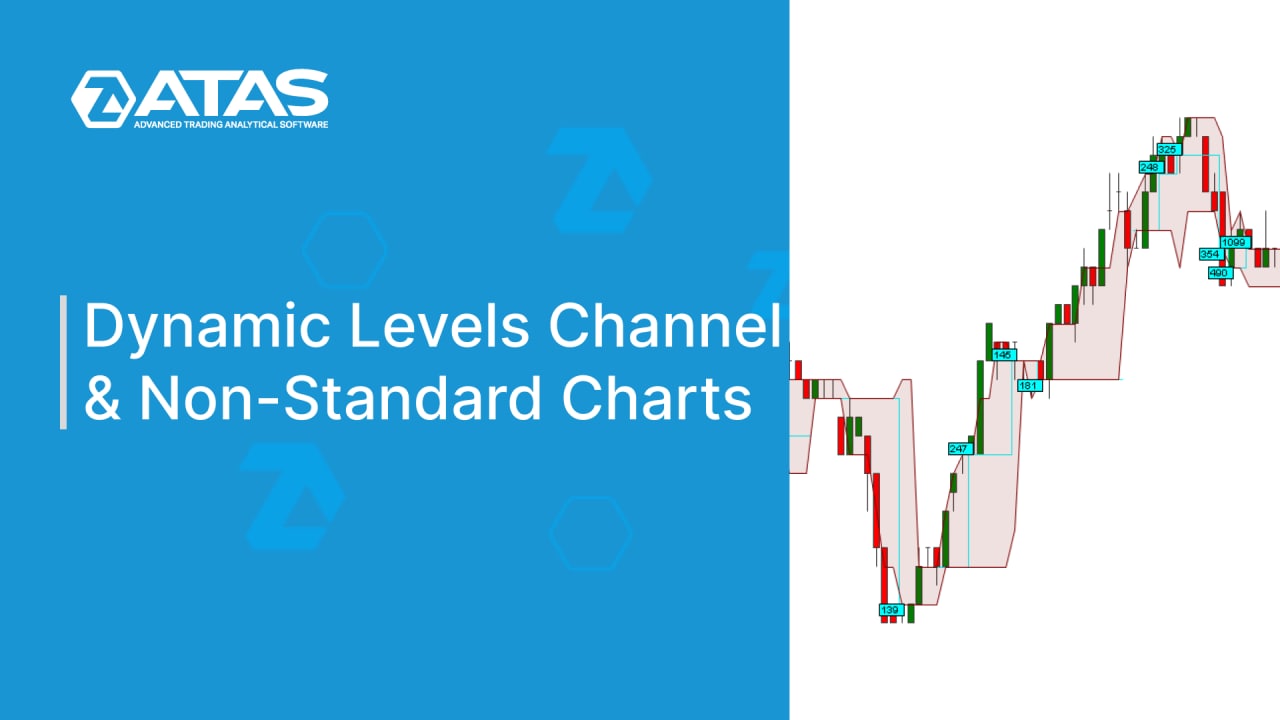
In this video we’ll discuss how to apply such a useful and informative indicator as the Dynamic Levels Channel. And what’s more important, how to use it on non-standard charts.
Watch video - https://youtu.be/CwRr1iBROTQ
Support service bot
Chat group for communication
Watch video - https://youtu.be/CwRr1iBROTQ
Support service bot
Chat group for communication
🔥6👍1
⚡️Market Replay has appeared in the ATAS platform! ⚡️
It allows you to replay history and trade as if the charts were being formed in real time. This is a universal simulator that uses tick history of more than 10 exchanges to recreate market situations as realistically as possible.
Why Market Replay ATAS is cooler than its alternatives
We are not the first to turn to historical data. But Market Replay is implemented much better in the ATAS platform than any other instrument you have worked with:
💥Detailed history including unique Level II data. Only in the Market Replay of the ATAS platform you can use the advantages of the DOM, market depth, and limit orders.
💥Data is downloaded directly from the server. There is no need to download archives with history, fill up your drive space, and synchronize them with the trading simulator.
💥You can use history at any time. There is no need to keep your computer turned on and wait for hours for data to accumulate in real time. Just choose the date you want and start trading!
What special features are waiting for you in Market Replay
Market Replay will be of interest to both pros and beginner traders. It provides more opportunities than testing strategies on a demo account in real time.
You are not stuck in the current market situation – you can travel back to any day in the history.
Flexible speed settings save you time – use fast forward to see the result of a trade almost right away.
When you trade on history, you do not risk real capital!
✅Set the time range - choose the start and end dates of the trading.
✅Explore the behavior of different markets: crypto, futures, stocks.
✅Make long/short trades using limit/market orders without risking real money.
✅Analyze the results of your trading in the statistics window.
✅Control the playback speed: slow down the drawing of the chart to 0.1x or speed up the visualization by 50x or more.
✅Use your favorite instruments: Smart DOM, Scalping DOM, Smart Tape, Bid/Ask tape, all available indicators.
✅Pause Replay at any time to track the logic of asset movement in the market.
Many traders spend their whole lives and impressive sums of money to find the Holy Grail. ATAS saves you years and money! Travel back in time with Market Replay to simulate as many historical trading cases as possible and prepare for the challenges of the real market.
Details at the link https://bit.ly/market_replay
Support service bot
Chat group for communication
👍11🔥3
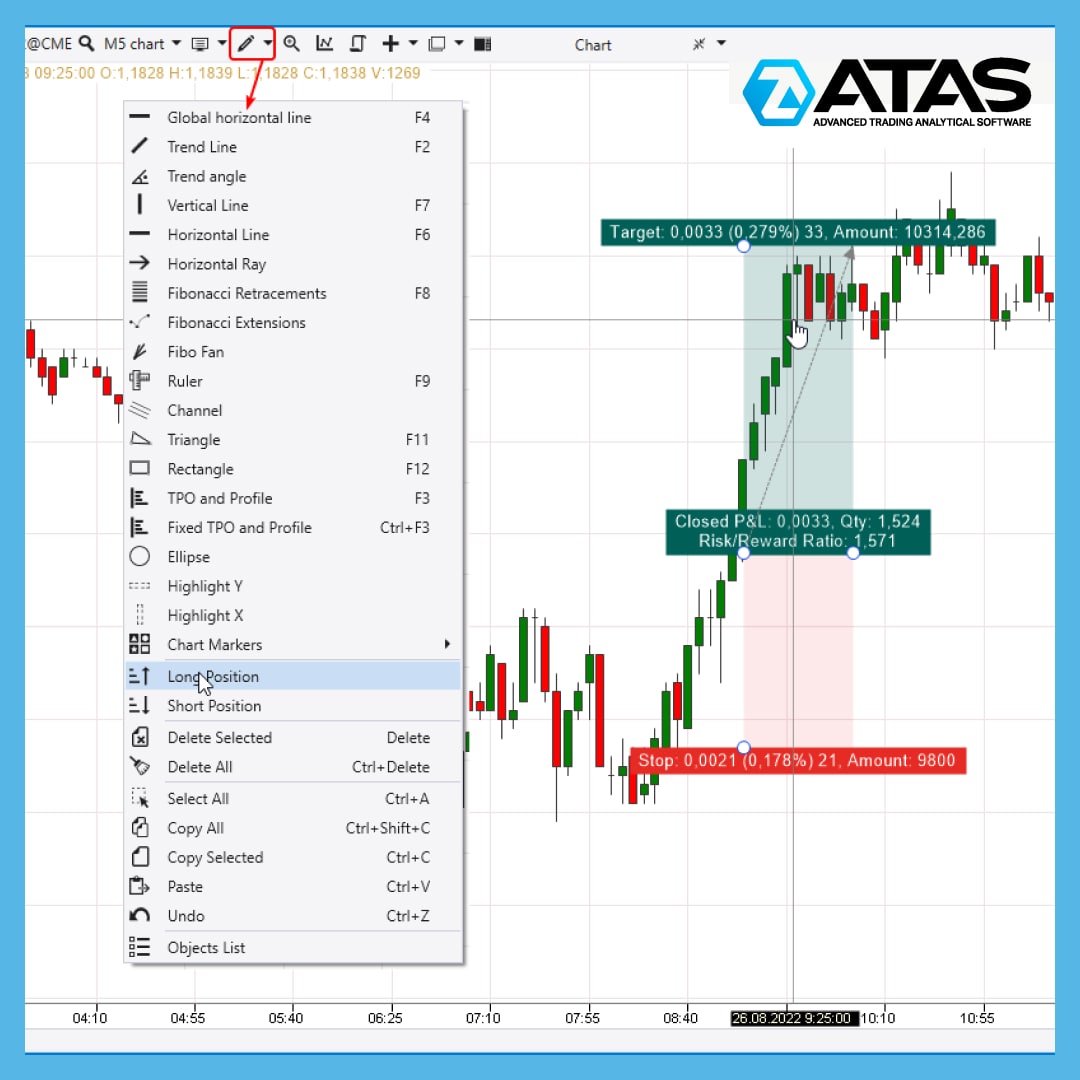
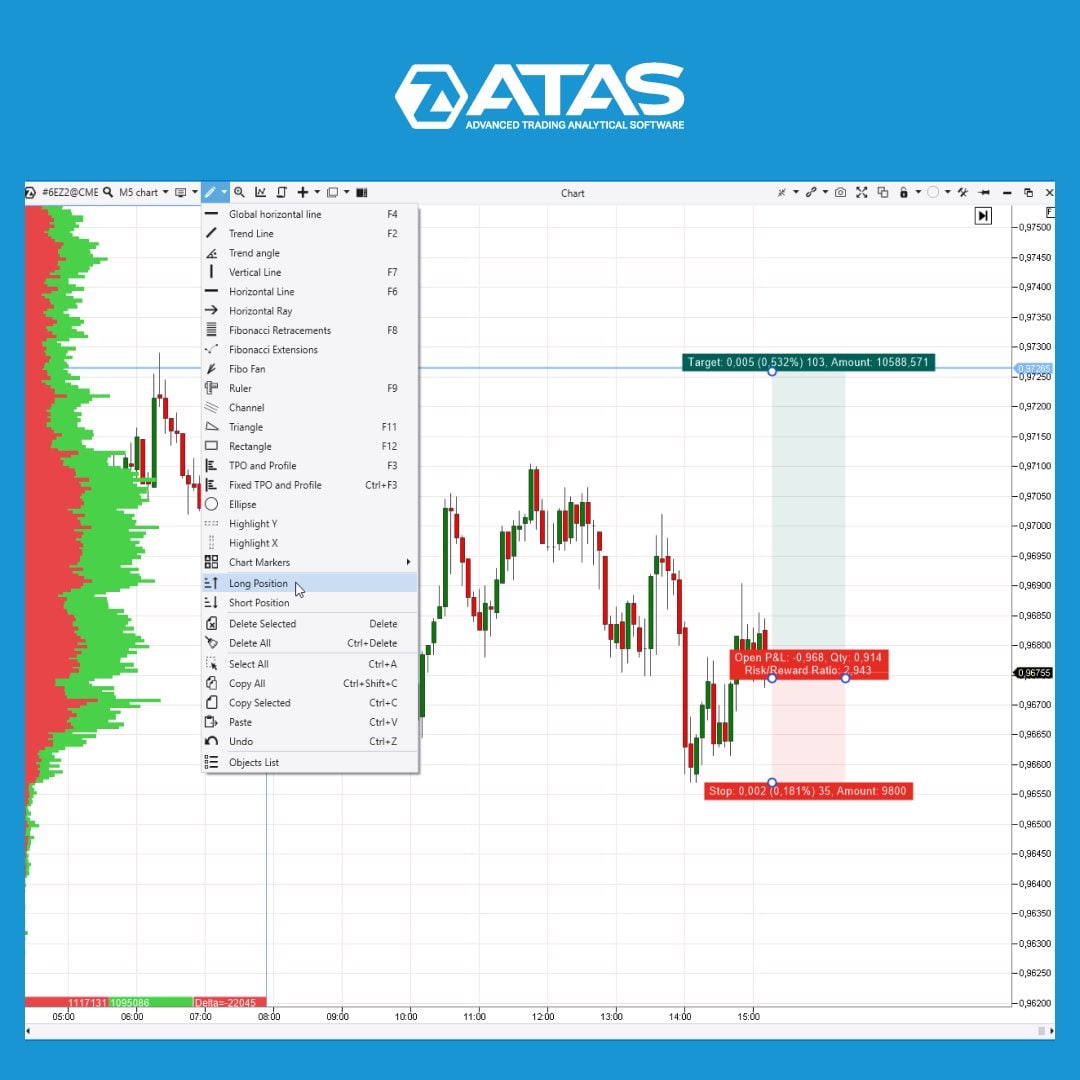
DRAWING TOOL FOR DEAL PLANNING
We share a life hack for planning trading operations in the ATAS platform. Applying it is very simple:
👉 From the drawing menu, select Long Position (if you plan to go long) or Short Position (if you plan to go short).
👉On the chart, indicate the levels: where the position will be opened, where you plan to set stop loss and take profit.
👉The ATAS platform will calculate the ratio of accepted risk to potential profit – Risk:Reward Ratio.
In the tool settings, you can specify your account size, the maximum allowable risk relative to the account size (2% by default), and adjust the take profit and stop loss levels.
The platform will provide key figures for the planned deal. This will allow you to manage your capital more effectively and focus on analyzing volumes and searching for ideas, instead of being distracted by calculations.
What other drawing tools are there, what they can be useful for and how to set them up - read in the Knowledge Base.
Download the platform and enjoy all the benefits of trading in ATAS right now: http://bit.ly/3hI0s7L
Support service bot
Chat group for communication
👍6
Many traders still believe in Christmas miracles. However, the harsh reality is that financial markets are a highly competitive business, where each participant pursues the goal of making money. But, perhaps, the so-called Santa Claus Rally will help you get the long-awaited "trader gifts"? 🎁
🎅 What is Santa Claus Rally?
🎅 5 possible reasons for its occurrence.
🎅 The pros and cons of the strategy.
🎅 Is it worth waiting for gifts in the financial markets?
Read the new article on our blog at the link: http://bit.ly/3FzB1xe
Support service bot
Chat group for communication
🎅 What is Santa Claus Rally?
🎅 5 possible reasons for its occurrence.
🎅 The pros and cons of the strategy.
🎅 Is it worth waiting for gifts in the financial markets?
Read the new article on our blog at the link: http://bit.ly/3FzB1xe
Support service bot
Chat group for communication
👍4
Merry Christmas !🎄
Peace, love, happiness and harmony we wish to you today and may love fill your home with blessings. Enjoy this season with your family and dear ones.
Due to the holiday, trading on exchanges is stopped.
👉 For information about other exchanges, please check their holiday calendars.
Peace, love, happiness and harmony we wish to you today and may love fill your home with blessings. Enjoy this season with your family and dear ones.
Due to the holiday, trading on exchanges is stopped.
👉 For information about other exchanges, please check their holiday calendars.
❤9🎉1
🥂 What Do Traders Toast for During the New Year Night?
For Good Luck and Not Only 🎄🎄🎄
Dear colleagues, we wish you a happy New Year 2023!
🎉 The grand ATAS promotion is wrapped! Thanks to everyone for participating. You can watch the winners drawing process on our YouTube channel 👇
https://youtu.be/D5ejPTk5pVc
You have worked hard this year, and now it’s time to party even harder!
For everyone who has bought a promo license, we are announcing the "New Year holidays time" – we are giving 2 weeks of free tariff plan during the winter holidays.
Hppy New Year!
❤4
🎄Happy New Year, traders!
Our support service will work during the New Year holidays according to the next schedule:
📌 January 2 - Day off
📌January 3 and after:
Support service works as usually
😎Best wishes for the coming year,
ATAS Team
Our support service will work during the New Year holidays according to the next schedule:
📌 January 2 - Day off
📌January 3 and after:
Support service works as usually
😎Best wishes for the coming year,
ATAS Team
How often do you use a Volume Zone Oscillator? How often do you trade on charts like Delta? We recommend that you familiarize yourself with their non-standard combination in order to receive signals about reversals and build a unique trading strategy.
From the new article at the link in the profile you will learn:
👉 What is a Volume Zone Oscillator?
👉 What is Delta Chart?
👉 How to use them to find reversals.
👉 How beginners can use VZO divergences on Delta Chart
The article provides a lot of examples. Surely, they will be useful to those who want to start trading on the stock exchange like a professional. Share the link on the trading resources: https://bit.ly/3Q8Ti9D
#vzo #delta #indicators #tradingstrategy
👍10
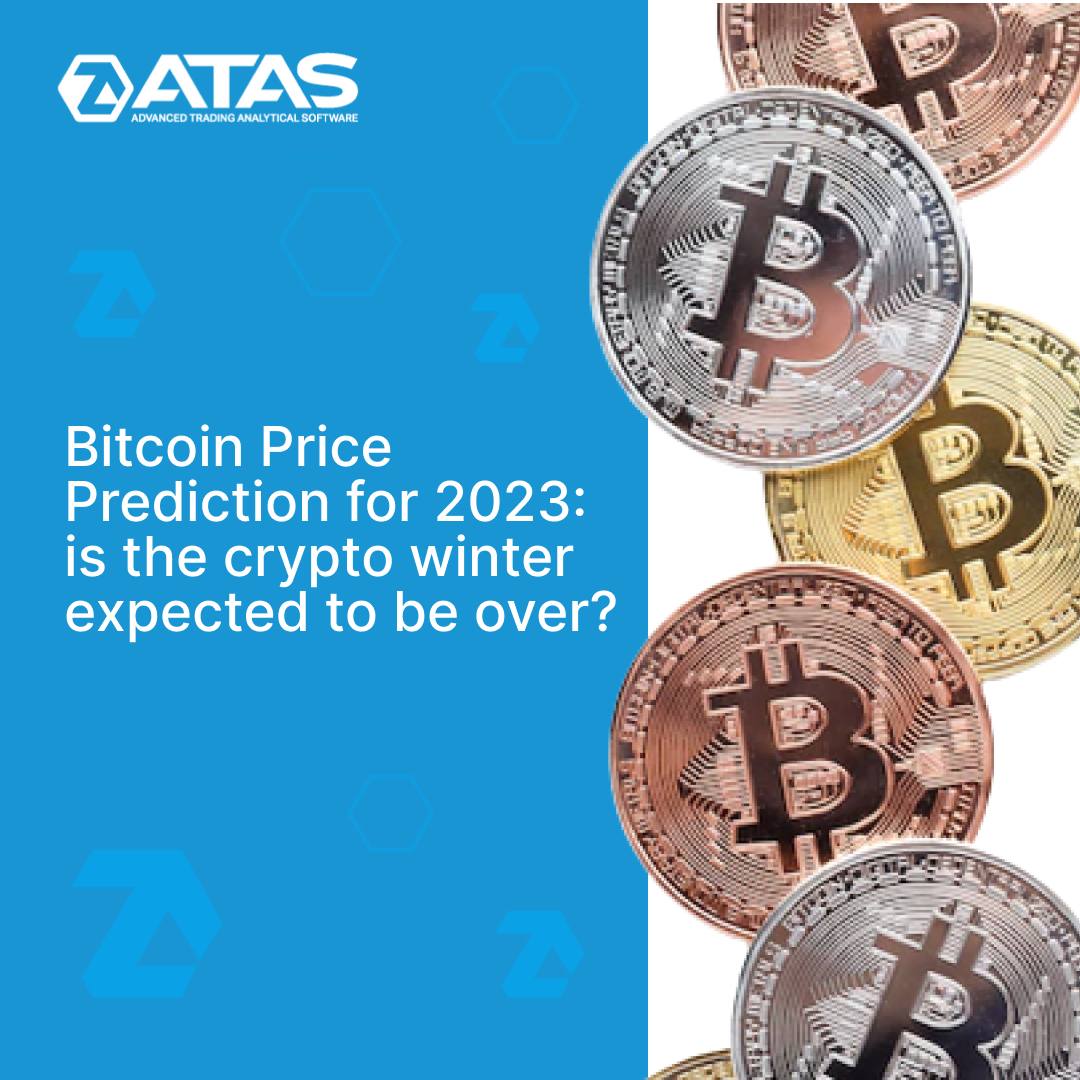
2022 allowed us to draw the following conclusions regarding cryptocurrencies:
👉 Bitcoin does not protect you against inflation.
👉 The cryptocurrency market is heavily influenced by margin positions.
👉 The market requires regulation to be protected from scammers’ bankruptcies.
What will happen in 2023? We have collected the top 20 predictions for 2023 from cryptocurrency market experts, and also added our own guess: https://bit.ly/3ZqWWju
The ATAS team wishes you successful trading in 2023!
#crypto #cryptocurrency #bitcoin
👍9
STATISTICS MODULE
You can open this module from the main ATAS menu (1).
The statistics module shows data on the trader's activity. It is updated in real time by default (2). You can also customize the display of statistics for a specific period in the past. Moreover, ATAS allows you to analyze statistics on different accounts, including the Replay account.
Using this module, you can analyze:
👉 total profit, the number of profitable/unprofitable trades,
👉 drawdown, profit factor, commission sizes.
Separate tabs show:
👉 trader's journal;
👉 Equity curve, other important information.
The statistics module is an indispensable instrument in the work of a trader (of course, if you treat trading as a systematic thing, not as a game of chance). Use the statistics module to identify your strengths and overcome your weaknesses.
Read more about the module in the Knowledge Base: http://bit.ly/3WdmnCb. The ATAS team wishes you continued success in 2023!
#workspace #tradingtips
👍8
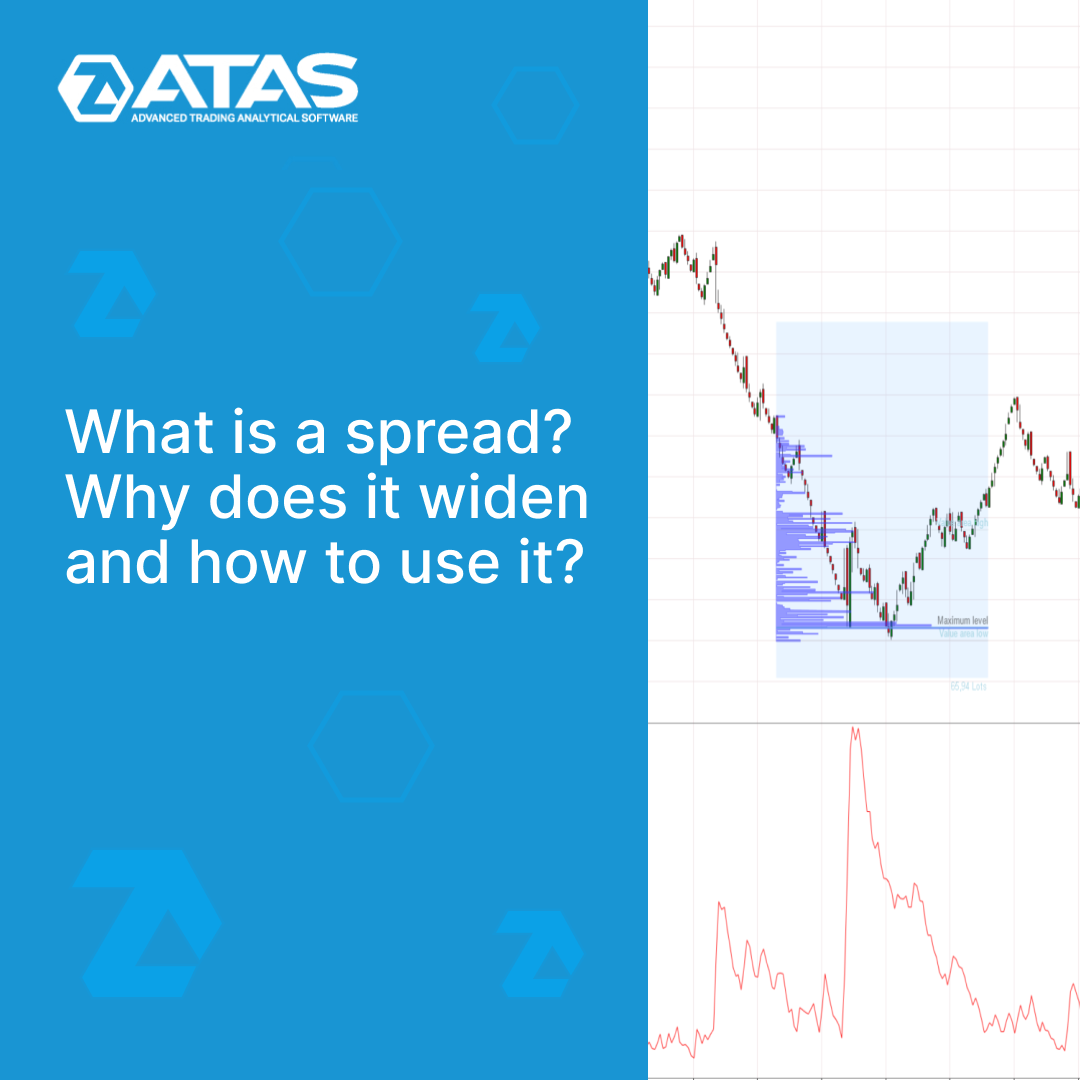
Why do spreads widen? This is a question that beginner traders may have, but even an experienced stock trader would find it difficult to answer this question. A new article in the ATAS blog focuses on the topic of a widening spread:
👉 What is a spread?
👉 Why does it widen?
👉 How to identify a widening spread
👉 Dangerous features of a widening spread
👉 How to use it in trading
Find out at http://bit.ly/3J7zwK8 and share with other traders. The article has detailed chart examples that you can use when developing your own strategy.
#spread #tradingtheory #tradingtips
🔥5👍1