
50 years ago Nixon declared a refusal of exchanging the dollar for gold, which was established in the 1940s. Gold sharply rose in value and the world entered the epoch of floating rates. It would seem that countries should become suspicious of the US dollar. However, its amount in reserves increased in the course of time and it still holds the status of the world’s main reserve currency
You can read in more details in our new article:
👉 what reserve currencies mean;
👉 how the dollar became the world’s main reserve currency;
👉 reasons of stability and shortcomings of competitors;
👉 how to trade the dollar index futures.
Share this article with those who look for working methods of trading in the exchange currency markets.
Read the article - https://bit.ly/3syUDwr
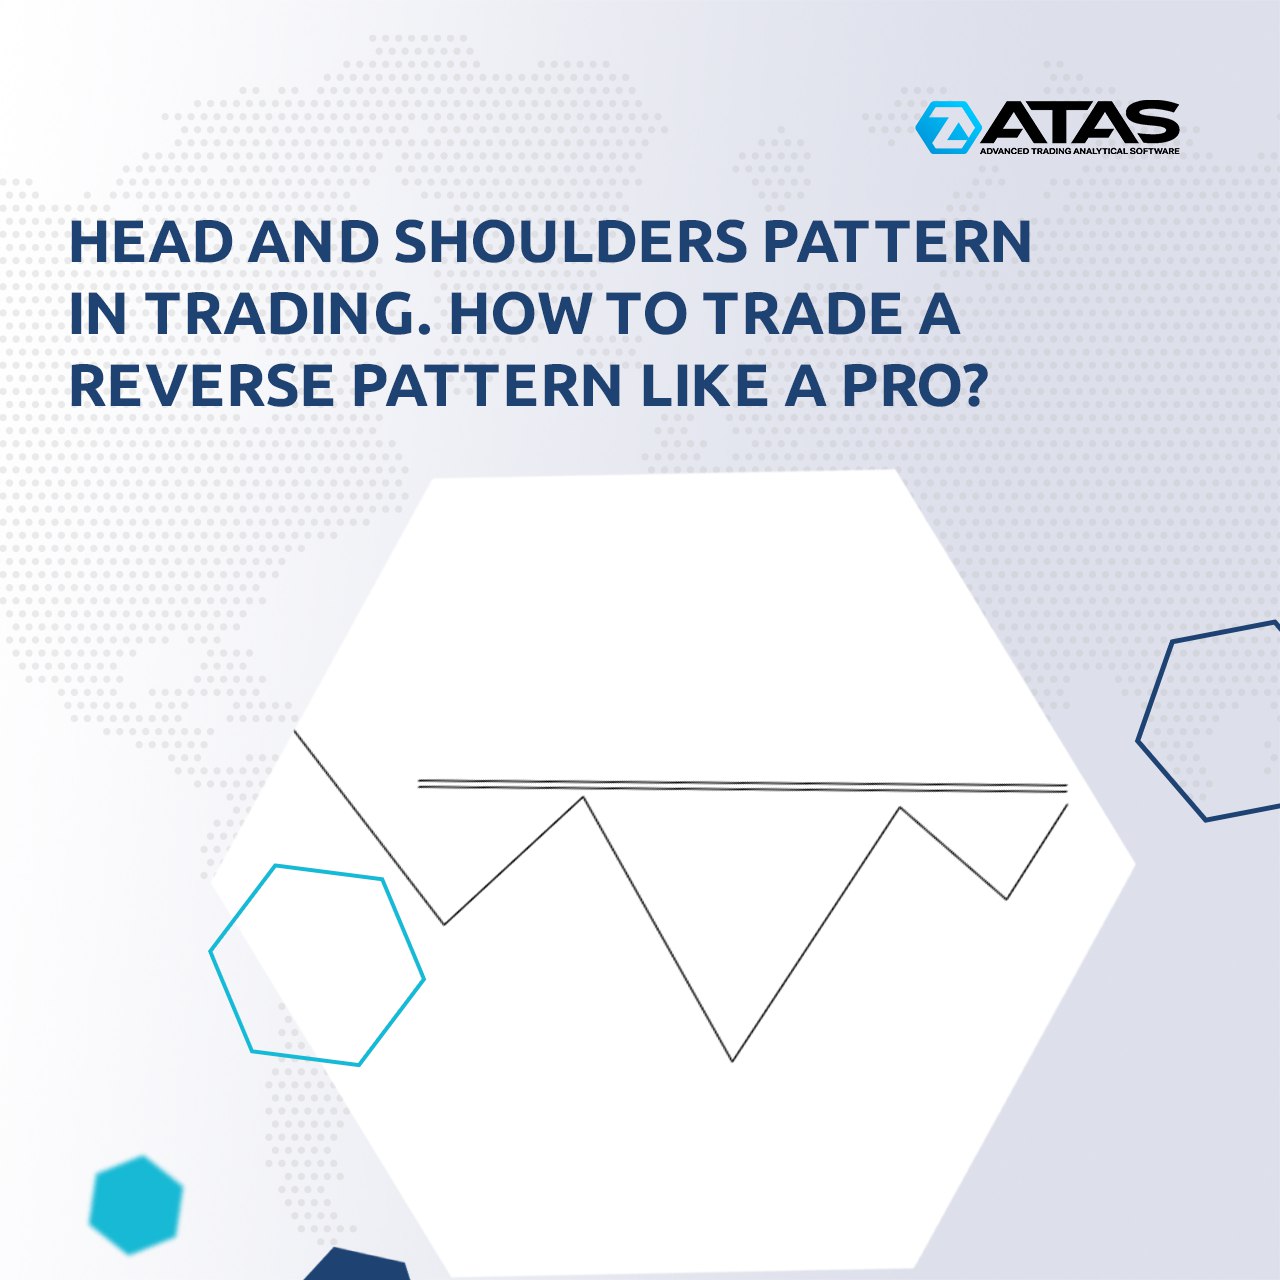
“The head and shoulders” is a popular technical analysis pattern. Various sources indicate that it has a high accuracy in predicting a trend reversal. Use the ATAS tools to improve the efficiency of trading with the head and shoulders pattern. In this article you will find out:
👉 How does the head and shoulders pattern look on a chart?
👉 What does it mean?
👉 How to trade?
👉 Advantages and disadvantages
👉 How can you use the head and shoulders pattern to improve your trading?
This article has a great number of chart examples. Share it with those who are looking for ways of improving their trading with cluster analysis.
Read the article - https://bit.ly/3Hyyt1j
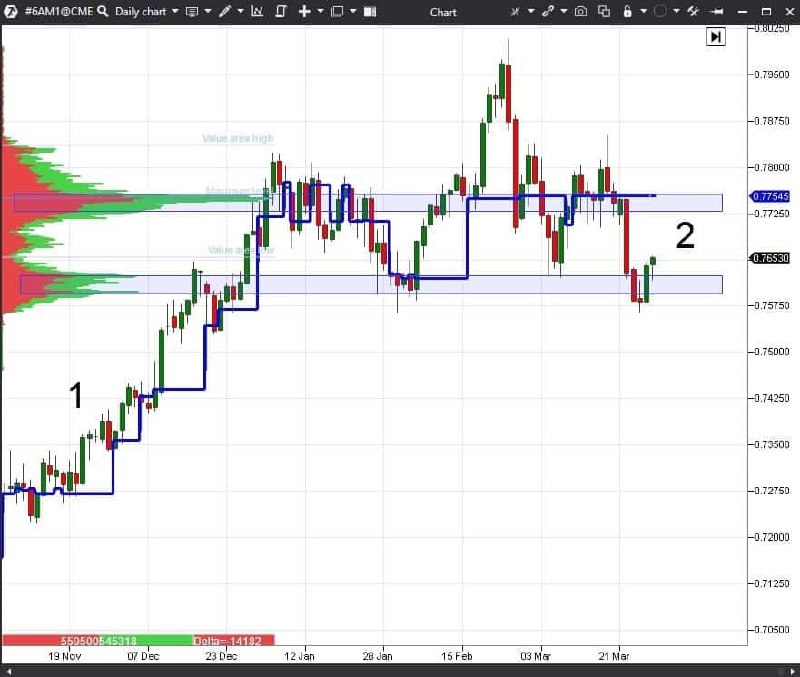
MARKET STRUCTURE ANALYSIS ON THE DAILY TIME-FRAME
It makes sense to start analysing the market structure on the daily time-frame since the long-term market structure is always more important and it is not efficient to trade against the daily tendency. You can use two instruments for analysis:
👉 Fixed TPO and Profile with the Contract period. This instrument clearly shows main levels of the maximum volumes, accumulated for the traded contract.
👉 Dynamic Levels with the Monthly period. This indicator allows you to remove the Value Area levels and mark the maximum volume level.
The chart above shows the daily AUD/USD futures (6A) chart.
The chart in point 1 is in the state of a sure trend and the price is steadily above the maximum volume level of the Dynamic Levels indicator. The volume, which flows into the market, pushes the price up. The maximum volume level consistently grows. Trend trading systems will work well in such a situation.
The situation changed in point 2. The maximum volume level of the Dynamic Levels indicator moves chaotically falling down and rising up. It tells us that the market is in a flat state. The Fixed TPO and Profile maximum volume levels clearly show the market corridor boundaries. Entry points of the price bounces inside the corridor could be looked for from these levels. Flat trading strategies will work well in such a market. You will be able to correctly develop a trading plan if you understand the current market structure.
Support service bot
Chat group for communication
🗓 ATAS support center schedule:
🔸 March 8 – holiday,
🔹 March 9 – we work as usual.
Best wishes,
the ATAS team
🔸 March 8 – holiday,
🔹 March 9 – we work as usual.
Best wishes,
the ATAS team
It is hard to be indifferent to gaps. Some traders love them because they provide unique opportunities to make money. Others dislike them because gaps make analysis more complicated.
A new article on our blog tells everything you need to know about gaps. Read in the article:
👉 What are gaps and why do they occur?
👉 Types of gaps and their specific features in different markets.
👉 Three gap trading strategies.
👉 Disadvantages of gap trading and how cluster charts can help you.
Share it with those who are looking for effective ways to earn money through trading.
Read the article - https://bit.ly/3w6hX6y
Support service bot
Chat group for communication
👍1
Dear friends, we have updated the ATAS platform BETA 5.7.29.208
- Interactive Brokers connector. Matching with CBOE EU instruments was added.
- Transaq connector. Cancellation of limit orders placed after the evening clearing was fixed.
- ByBit. The “price exceeds maximum allowed” error was fixed.
- CQG. Matching for the RB instrument was added.
- TPO. An ability to extend the lines of maximum volumes to the price scale was added.
- TPO. An ability to show the profile date (‘Show date’ parameter) was added.
- Smart Dom. Incorrect positioning of elements when loading was fixed.
- Chart. Switching to the full-screen mode in the GDI video rendering mode was fixed.
- Saving windows on different virtual desktops was fixed.
Read about other updates on our site - https://atas.net/atas-updates/atas-update/
Support service bot
Chat group for communication
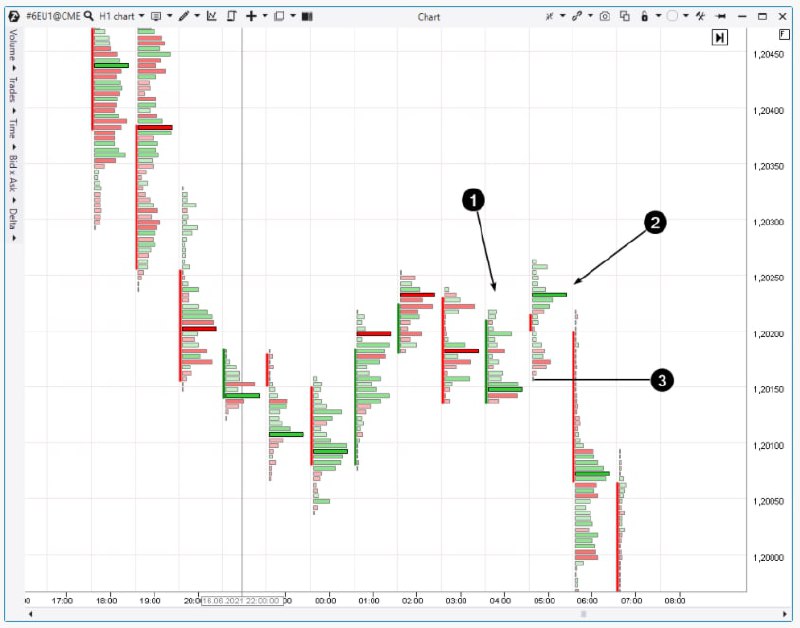
PATTERN 1. REVERSAL BAR
The Bullish Reversal pattern consists of two bars:
👉 The first bar is a down-bar.
👉 The second bar moves below the previous bar’s low and then closes above it.
The Bearish Reversal pattern is similar but opposite. The second bar moves above the previous bar’s high but closes with down movement.
Bullish Reversal gives ground to assume that the market found support below the previous bar’s low. Moreover, the support was strong enough to push the price up to make the second bar grow. This is the first sign of a probable reversal.
Cluster charts provide more transparency for understanding the current processes. Here’s a Bearish Reversal example in the 6E chart (CME Euro futures; hourly period).
Support service bot
Chat group for communication
👍2
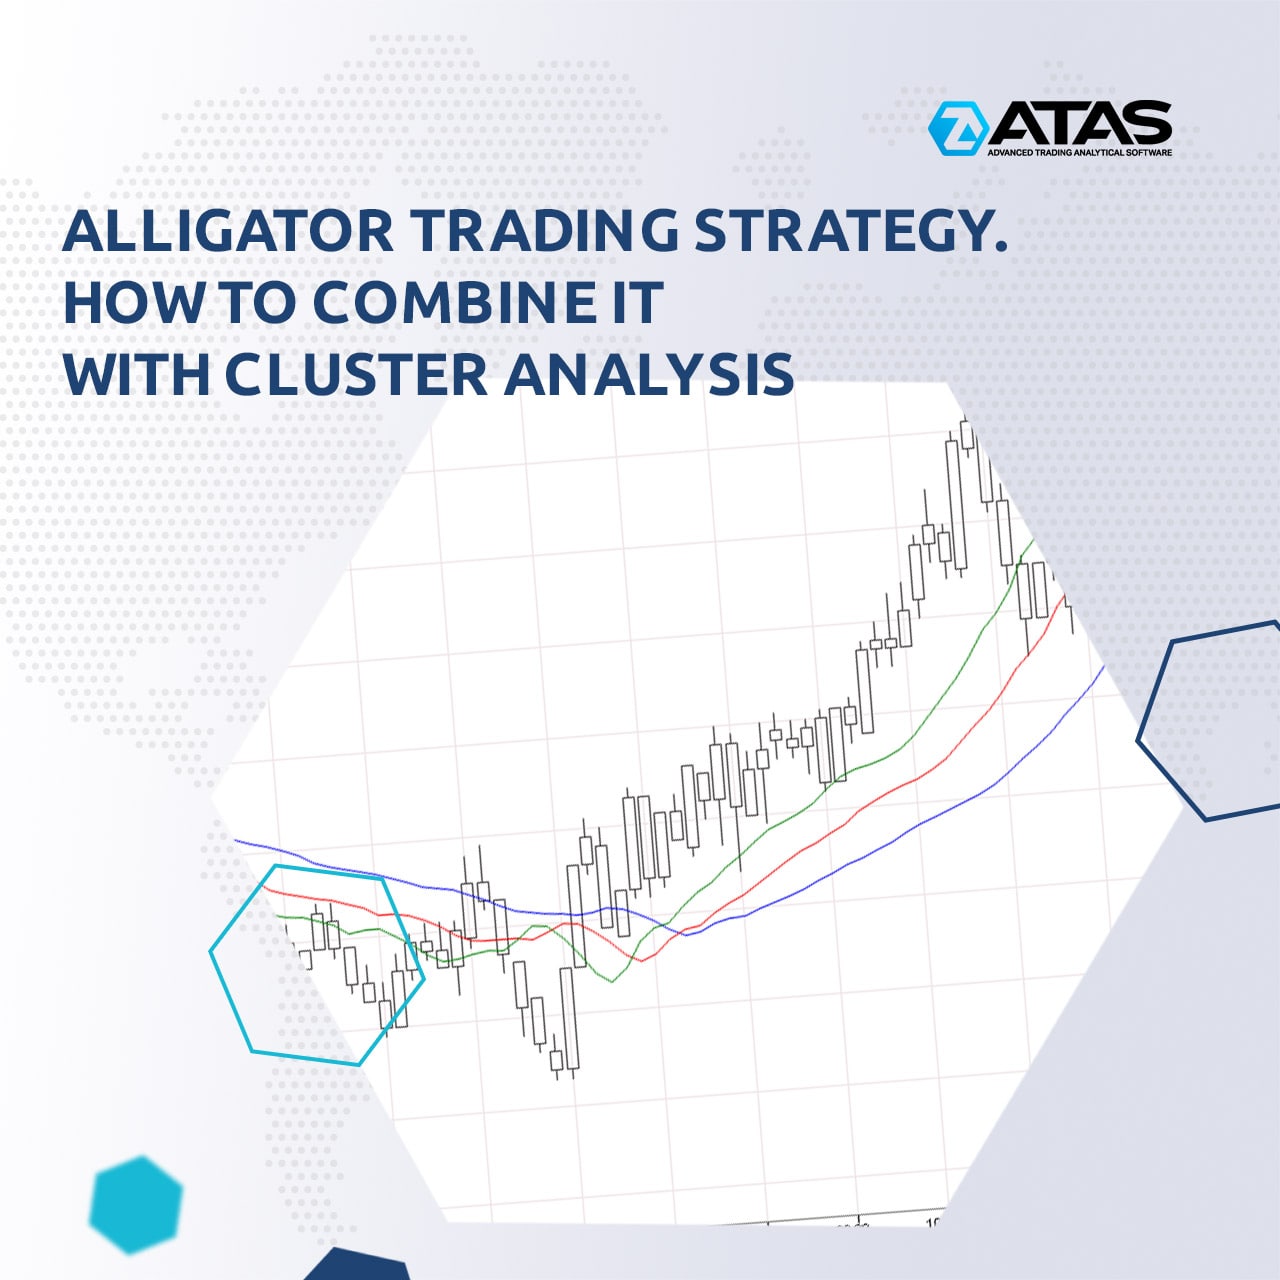
The Alligator is a classic indicator that was developed in 1995 by Bill Williams. According to the creator, his Alligator feeds on market Bulls and Bears and after the feast falls into hibernation.
A new article in our blog has everything you need to know about this dangerous predator. Read in the article:
👉 the idea of the strategy;
👉 how to interpret signals, chart examples;
👉 advantages and disadvantages of the Alligator;
👉 ways to improve trading, including cluster charts.
Share it with those who are looking for effective ways to earn money through exchange trading.
Read the complete article - https://bit.ly/3ipCP0G
Support service bot
Chat group for communication
👍1
Dear friends, we have updated the ATAS platform BETA 5.7.29.214
1. Scaling was added to the Smart DOM and indicators which use the Level2 data. Trading cryptoinstruments became even more convenient.
2. The logic of managing the Bid/Ask imbalance chart mode was changed:
2.1. Common chart settings->Cluster Settings->Bid/Ask Imbalance settings. An ability to switch on/off the Bid/Ask Imbalance mode was added. Also Bid and Ask colors were added. Previously, the Bid and Ask colors of the common cluster settings were used, and in some situations the values merged with the background. Now it is possible to configure everything separately.
2.2. Now the Bid/Ask Imbalance settings are applied to all cluster modes which display Bid and Ask values.
2.3. In the sidebar of the chart, the "Bid x Ask Imbalance" mode was renamed to "Bid x Ask", while the "Bid x Ask" mode was renamed to "Bid x Ask Delta colored".
Read about other updates on our site - https://atas.net/atas-updates/atas-update/
Support service bot
Chat group for communication
👍1
Dear friends, we have updated the ATAS platform BETA 5.7.29.218
- Parameters of Rithmic servers were updated.
Read about other updates on our site - https://atas.net/atas-updates/atas-update/
Support service bot
Chat group for communication
- Parameters of Rithmic servers were updated.
Read about other updates on our site - https://atas.net/atas-updates/atas-update/
Support service bot
Chat group for communication
A double top and a double bottom are popular technical analysis patterns. They can be simple and common on historical data but they are difficult to trade in real time. Use confirmations from professional tools on the ATAS platform to identify real patterns more effectively.
Read about it in our new article on double top and bottom patterns:
👉 how these patterns look on the chart;
👉 two trading approaches;
👉 advantages and disadvantages;
👉 how to improve trading with cluster analysis in detail.
This article has a great number of chart examples. Share it with those who are looking for ways of improving their trading with classic patterns of technical analysis.
Read the complete article - https://bit.ly/3iKRVyc
Support service bot
Chat group for communication
👍3
Dear friends, we have updated the ATAS platform Latest 5.7.29.325
- Interactive Brokers connector. Matching with CBOE EU instruments was added.
- Transaq connector. Cancellation of limit orders placed after the evening clearing was fixed.
- ByBit. The “price exceeds maximum allowed” error was fixed.
- CQG. Matching for the RB instrument was added.
- TPO. An ability to extend the lines of maximum volumes to the price scale was added.
- TPO. An ability to show the profile date (‘Show date’ parameter) was added.
- Smart Dom. Incorrect positioning of elements when loading was fixed.
- Chart. Switching to the full-screen mode in the GDI video rendering mode was fixed.
- Saving windows on different virtual desktops was fixed.
- Scaling was added to the Smart DOM and indicators which use the Level2 data. Trading cryptoinstruments became even more convenient.
- The logic of managing the Bid/Ask imbalance chart mode was changed.
Read about other updates on our site - https://atas.net/atas-updates/atas-update/
Support service bot
Chat group for communication
👍3
Dear friends, we have updated the ATAS platform BETA 5.7.30.200
✅ Binance - trading on demo accounts was added.
✅ The ability to scale the Smart Dom was added.
✅ The ability to search by a setting name was added to the chart settings.
✅ The ability to zoom in candles in any mode to quickly view the content in the form of clusters was added.
It is possible to activate the Magnifyer mode in 2 ways:
1) By pressing the button in the control panel;
2) By using the hot key. By default it’s the “M” button. In the magnified mode, clusters are displayed according to the modes set in the settings.
✅ Cluster charts were significantly improved.
The following settings were added to the cluster settings:
1) Content - sets numerical values in clusters.
2) Mode - configures the form of each price level.
3) Color scheme - colors price levels.
Thanks to this, it became possible to get more than 400 different types of clusters. At the same time, the ability to select preset modes in the chart sidebar remained.
Additionally:
1) The ability to color clusters according to the heatmap principle was added to the color settings (the principle of settings is similar to the Dom Levels indicator).
2) The "Draw borders” parameter, which allows to frame each price level in a rectangle, was added.
3) The order of cluster settings was reorganized, categories of settings were added.
4) Cluster settings can now be easily accessed from the chart sidebar without opening the common settings window.
5) The "Custom rows height" property, which allows to set a custom fixed height of price levels, was added to the cluster settings.
✅ The ability of demo trading Binance futures on Crypto Sim was added. Now there are two Crypto connections in the connection settings:
1) Crypto data - connection for receiving market data
2) Crypto Sim - connection to the ATAS demo server
✅ Fixes:
1) Problem of receiving online data from CQG with the top of book subscription
2) The “You must enter a valid price” error of Interactive Brokers
3) Multiple target exit strategy. Entering big volume values was fixed
4) The bug when switching to the Full-screen mode in the GDI rendering mode was fixed
Read about other updates on our site - https://atas.net/atas-updates/atas-update/
Support service bot
Chat group for communication
🔥3
❗️ Greetings, dear colleagues!
We need to provide you with the best service, and only YOU can help us with this!
We will be very grateful if you can answer a few questions during the interview (not publicly available, it will take 30-40 minutes).
We will choose a few respondents with whom we can interact to understand better their experience of the platform usage.
Who is ready to help with our project, please leave your contact details in the form.
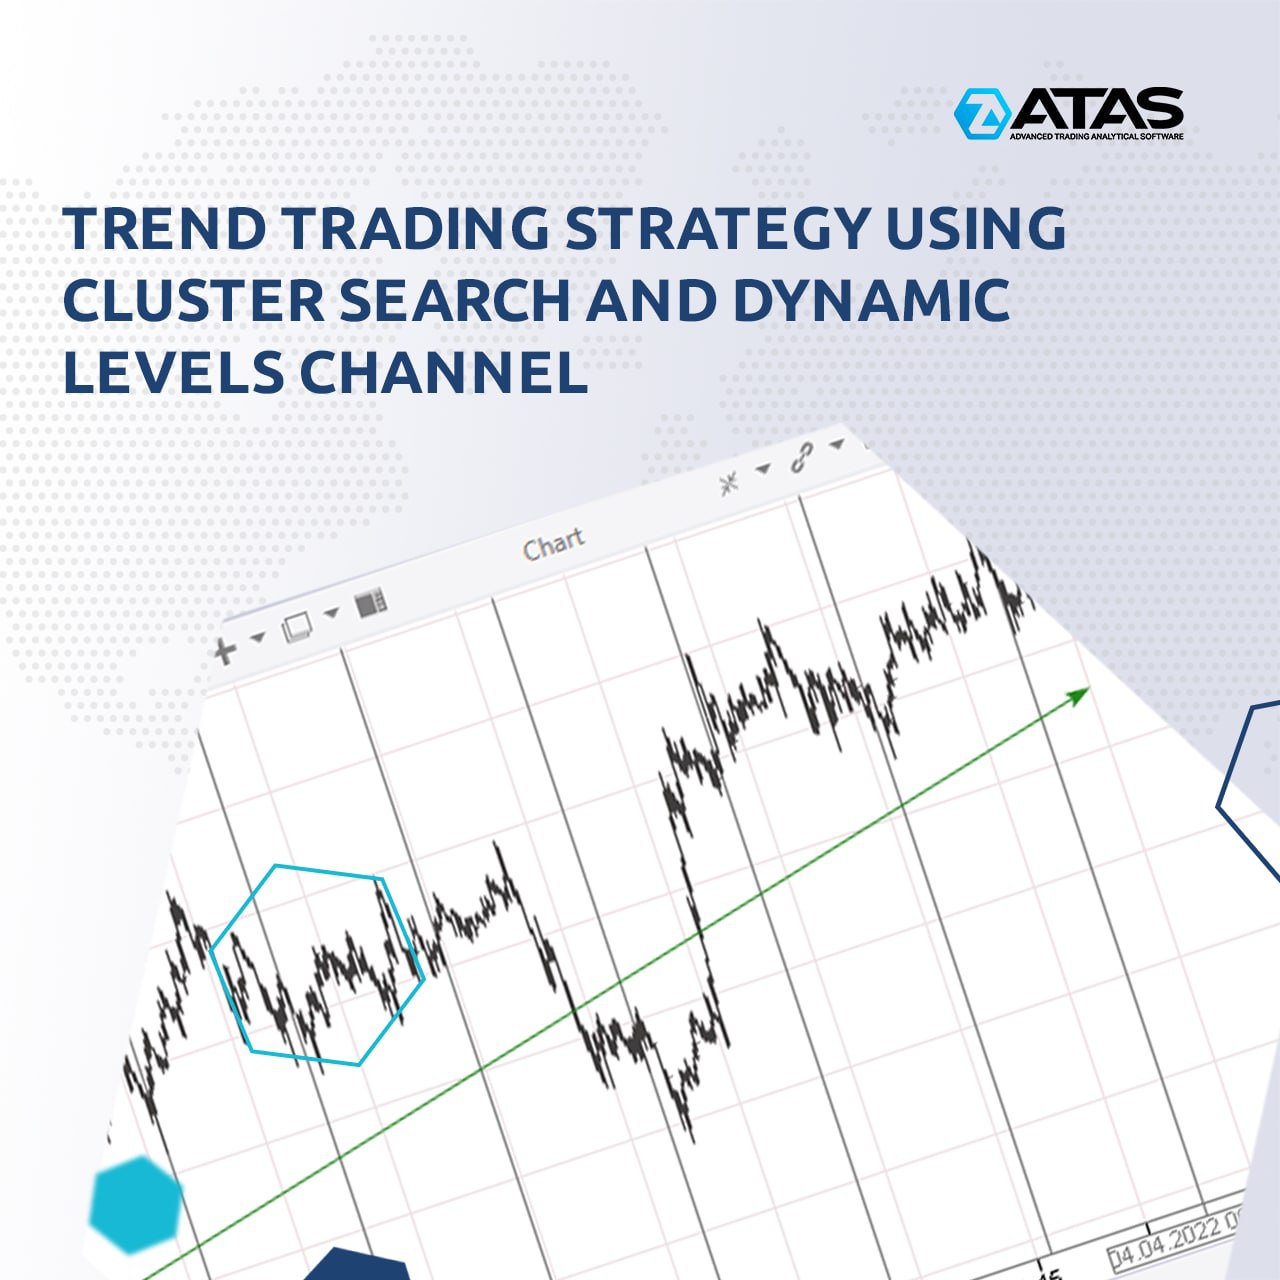
Trend trading is recommended for beginner traders, but remember that the price does not change in a straight line, otherwise it would be too easy to make money.
Usually there will be local lows during trends to make it harder for buyers to trade, i.e. to motivate them to close a position manually or by stop losses.
In our new article we describe a simple (but effective) trading strategy using two indicators: the Dynamic Levels Channel and the Cluster Search. In general terms, the strategy is designed to enter a position when others exit because they believe that the trend is over.
Read in the article:
👉 Benefits of trend trading
👉 What is Dynamic Levels Channel
👉 What is Cluster Search
👉 Idea of trend trading strategy
👉 Examples
The article has chart examples. Share it with those who are looking for effective ways to earn money through trend trading.
Read the complete article - https://bit.ly/3kS1IU9
Support service bot
Chat group for communication
👍6
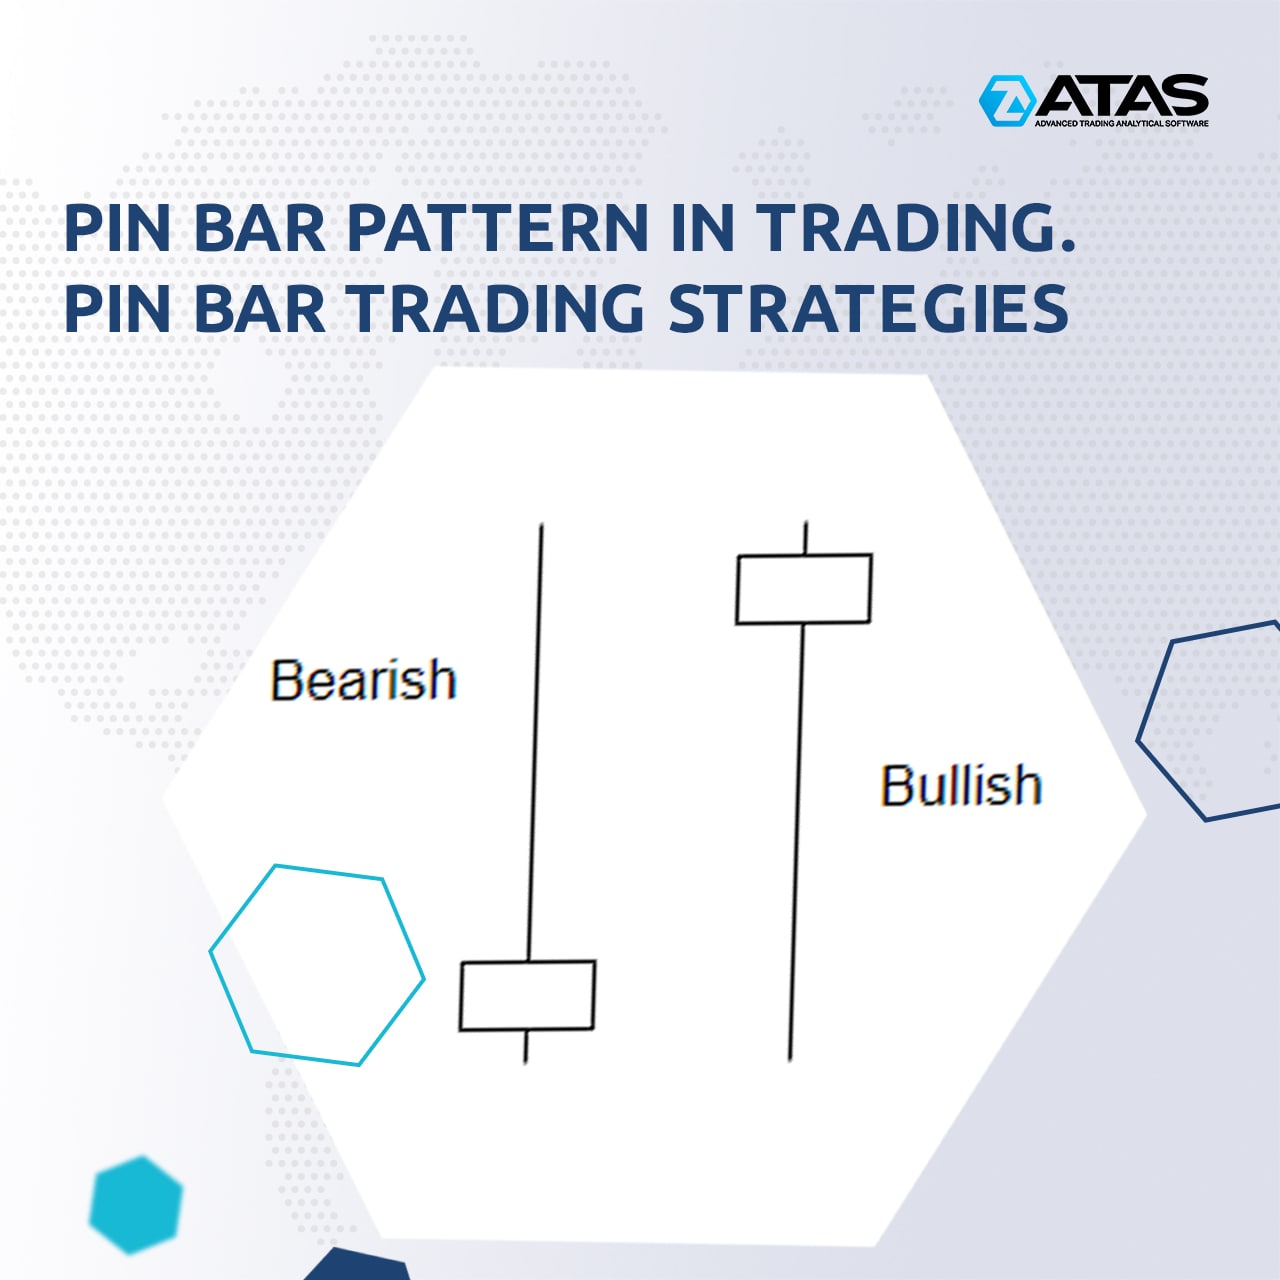
Pin bar trading may seem appealing to beginner traders, but simple strategies (buy after a bullish pin bar, sell after a bearish one) are likely to be disappointing.
Our new article provides information on more effective ways of pin bar trading using volume analysis tools, such as the following indicators: Cluster Search, Market Profile, Delta, Bar Patterns.
This article has numerous practical examples. Share it with those traders who are looking for effective ways to earn money through pin bar trading.
Read the complete article - https://bit.ly/3Ni9z9z
Support service bot
Chat group for communication
👍3
❗️ Greetings, dear colleagues!
We need to provide you with the best service, and only YOU can help us with this!
We will be very grateful if you can answer a few questions during the interview (not publicly available, it will take 30-40 minutes).
We will choose a few respondents with whom we can interact to understand better their experience of the platform usage.
Who is ready to help with our project, please leave your contact details in the form.
We need to provide you with the best service, and only YOU can help us with this!
We will be very grateful if you can answer a few questions during the interview (not publicly available, it will take 30-40 minutes).
We will choose a few respondents with whom we can interact to understand better their experience of the platform usage.
Who is ready to help with our project, please leave your contact details in the form.
Dear friends, we have updated the ATAS platform BETA 5.7.31.210
New functionality:
✅ Supporting for the Binance Futures and Bybit marginal trading was significantly improved:
✔️ the ability to manually change the leverage and margin type was added;
✔️ new position parameters for margin trading such as liquidation price, margin mode, mark price were added;
✔️ the ability to change the isolated margin for a position was added;
✔️ the position window was redesigned: now you can filter positions and show only those you need. Besides, there can be many position windows with different settings, now positions support templates.
✅ The Scalping DOM indicator was improved
✔️ auto-centering by pressing the Shift key was added;
✔️ auto-centering was added. It centers the chart when the mouse is outside the area for placing new orders and the price approaches the upper or lower chart border;
✔️ the order ping output was added. Ping is calculated as the time between sending an order and receiving the first status on it from the connector. If the ping is less than 500, it is highlighted in green. If it is from 500 to 1000, it is highlighted in yellow. If it is over 1000, it is highlighted in red.
✅ The "Mouse wheel behavior” option, which controls the chart reaction to the mouse wheel, was added to the visual chart settings. There are 2 options: Zoom - zooms in the chart, Scroll - scrolls the chart to the left or right. In addition, the chart zooming logic when scrolling the mouse and holding down the Ctrl key was changed. Now, in this case, the chart is zoomed in, but the candle, over which the mouse pointer is, remains under the mouse pointer.
✅ The ability to hide the cluster mode selection sidebar was added to the chart settings. It can be useful in workspaces which contain a large number of cluster charts.
✅ Two modes were added to the cluster settings filters: Relative Volume, Relative Trades. In these modes, you must set %% of the maximum volume, above which the clusters will be highlighted. For example, Relative Volume is set to 90. This means that all clusters whose volume is higher than 90% of the maximum volume visible on the chart will be highlighted.
Fixes:
✔️ The ability to select a volume <10 for stocks was implemented (the TRANSAQ trading server);
✔️ The Cluster Search indicator display in clusters in the Only Price mode with Price Range>1 was fixed;
✔️ SmartDOM auto-centering on double click during a high volatility period was fixed.
Read about other updates on our site - https://atas.net/atas-updates/atas-update/
Support service bot
Chat group for communication
👍2
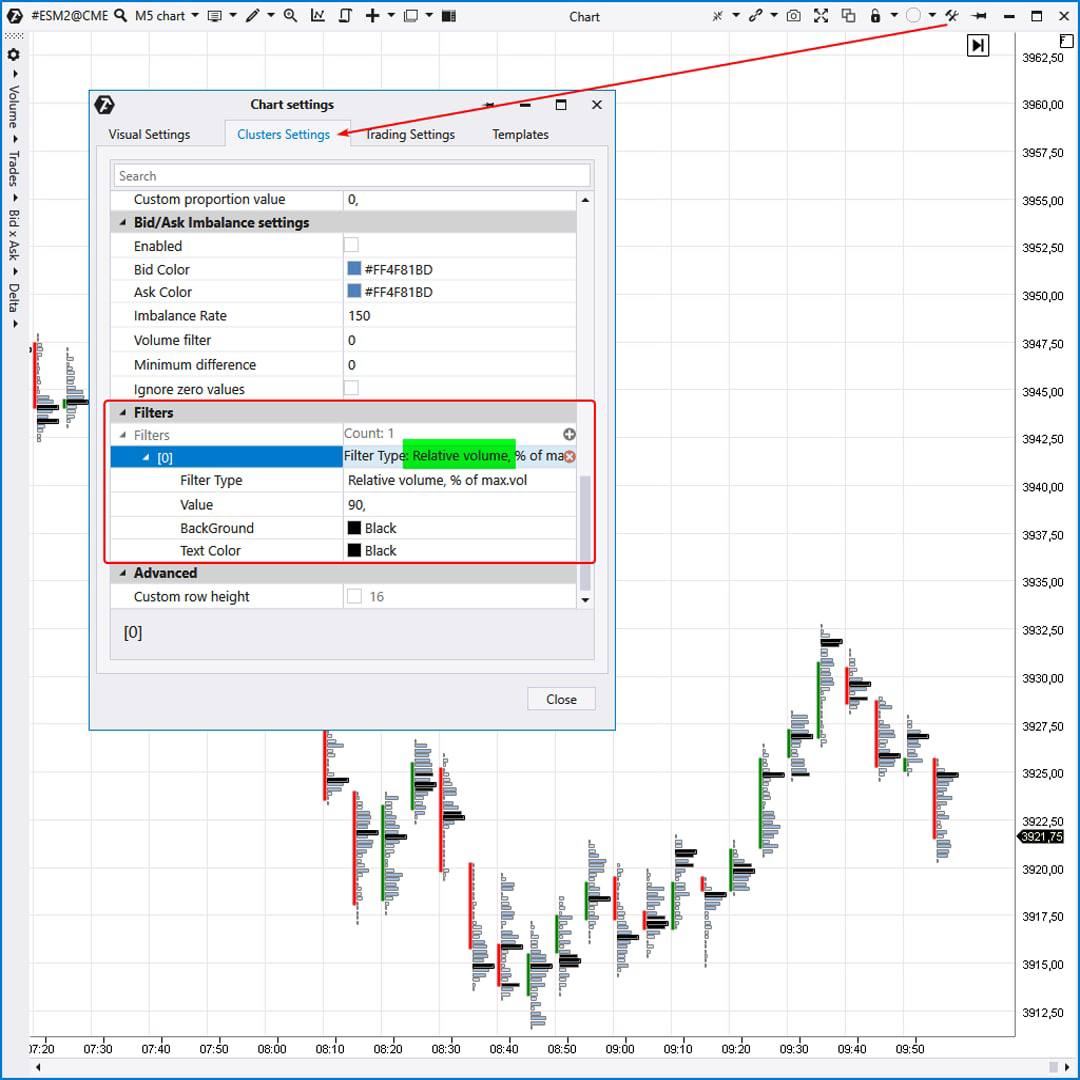
The Relative Volume filter is a new feature for cluster charts
Traders and technical analysts of financial markets might often have a problem with charts that need to be readjusted every time when changing time frames and/or financial instruments. The reasons why this happens are obvious. The more often you have to change the time frame or something else, the more urgent the problem is.
A possible solution is to create a database of your own templates (snapshots) that will store settings of charts and indicators, but this option has its drawbacks.
👉As a matter of our users’ convenience, the team of the ATAS analytical platform has discovered a particular solution – the Relative Volume filter that can be applied to a cluster chart.
☝️ Please note that the Relative Volume filter is currently available in a beta version of the ATAS platform. To launch the beta version use the corresponding menu on the welcome screen that appears when the platform starts.
To activate the Relative Volume filter:
✔️open the chart;
✔️go to the Cluster Settings tab in the chart settings;
✔️in the Filters section add the filter by clicking on the plus sign;
✔️in the filter settings select the Relative Volume (by volume or by the number of trades);
✔️enter the value as a percent.
For example, the filter Relative Volume = 90% on the attached chart. This means that ATAS automatically finds the largest volume among all clusters loaded on the chart and takes its value as 100%. After that all clusters whose volume is not less than 90% of the maximum are painted black.
Let's say we have used absolute values. If the period was changed, for example from 5 minutes to 4 hours, a lot of black clusters would appear on the chart. This would require time to readjust the filter. However, the work becomes much more convenient if you use relative values as percentages.
☝️Note that you can add multiple filters with different colors.
If you have any questions when setting up the Relative Volume filter for cluster charts, please contact our support service.
👍5
Dear friends, we have updated the ATAS platform LATEST 5.7.31.210
💪 New functionality:
✅ Supporting for the Binance Futures and Bybit marginal trading was significantly improved:
✔️ the ability to manually change the leverage and margin type was added;
✔️ new position parameters for margin trading such as liquidation price, margin mode, mark price were added;
✔️ the ability to change the isolated margin for a position was added;
✔️ the position window was redesigned: now you can filter positions and show only those you need. Besides, there can be many position windows with different settings, now positions support templates.
✅ The Scalping DOM indicator was improved
✔️ auto-centering by pressing the Shift key was added;
✔️ auto-centering was added. It centers the chart when the mouse is outside the area for placing new orders and the price approaches the upper or lower chart border;
✔️ the order ping output was added. Ping is calculated as the time between sending an order and receiving the first status on it from the connector. If the ping is less than 500, it is highlighted in green. If it is from 500 to 1000, it is highlighted in yellow. If it is over 1000, it is highlighted in red.
✅ The "Mouse wheel behavior” option, which controls the chart reaction to the mouse wheel, was added to the visual chart settings. There are 2 options: Zoom - zooms in the chart, Scroll - scrolls the chart to the left or right. In addition, the chart zooming logic when scrolling the mouse and holding down the Ctrl key was changed. Now, in this case, the chart is zoomed in, but the candle, over which the mouse pointer is, remains under the mouse pointer.
✅ The ability to hide the cluster mode selection sidebar was added to the chart settings. It can be useful in workspaces which contain a large number of cluster charts.
✅ Two modes were added to the cluster settings filters: Relative Volume, Relative Trades. In these modes, you must set %% of the maximum volume, above which the clusters will be highlighted. For example, Relative Volume is set to 90. This means that all clusters whose volume is higher than 90% of the maximum volume visible on the chart will be highlighted.
✅ Binance - trading on demo accounts was added.
✅ The ability to scale the Smart Dom was added.
✅ The ability to search by a setting name was added to the chart settings.
✅ The ability to zoom in candles in any mode to quickly view the content in the form of clusters was added.
It is possible to activate the Magnifyer mode in 2 ways:
✔️ By pressing the button in the control panel;
✔️ By using the hot key. By default it’s the “M” button. In the magnified mode, clusters are displayed according to the modes set in the settings.
✅ Cluster charts were significantly improved.
The following settings were added to the cluster settings:
✔️ Content - sets numerical values in clusters.
✔️ Mode - configures the form of each price level.
✔️ Color scheme - colors price levels.
Thanks to this, it became possible to get more than 400 different types of clusters. At the same time, the ability to select preset modes in the chart sidebar remained.
Fixes:
✔️ The ability to select a volume <10 for stocks was implemented (the TRANSAQ trading server);
✔️ The Cluster Search indicator display in clusters in the Only Price mode with Price Range>1 was fixed;
✔️ SmartDOM auto-centering on double click during a high volatility period was fixed.
Read about other updates on our site - https://atas.net/atas-updates/atas-update/
Support service bot
Chat group for communication
👍7